Summary
- Given the growth of EPS and free cash flow, Alphabet does not look expensive now.
- Looking at the forward multiples, especially in the context of expected EPS and revenue growth, the market is pulling Alphabet down.
- The company is still undervalued in the context of the present value of the potential future FCF volume.
- The current state of the market in many aspects has reached extreme points and this is a cause for concern.
Thesis
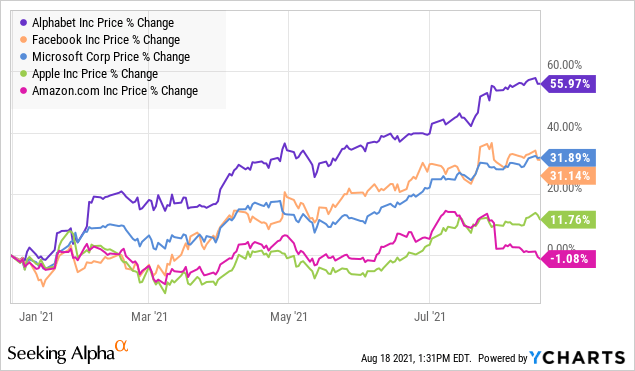
Among the companies from the FAAMG list, Alphabet (GOOG) (GOOGL) has shown the highest price return since the beginning of the year. However, maintaining the current rate of growth of the company's market capitalization looks doubtful. Moreover, the main reasons for these doubts do not relate directly to Alphabet.
Is Alphabet just growing or accelerating?
Alphabet started publishing disaggregated revenue data relatively recently, but even that data is enough to see how rapidly growth in the key segments of the company's business has accelerated over the past three quarters:
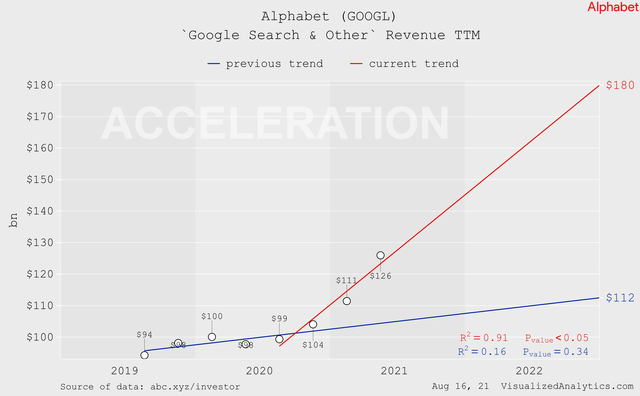
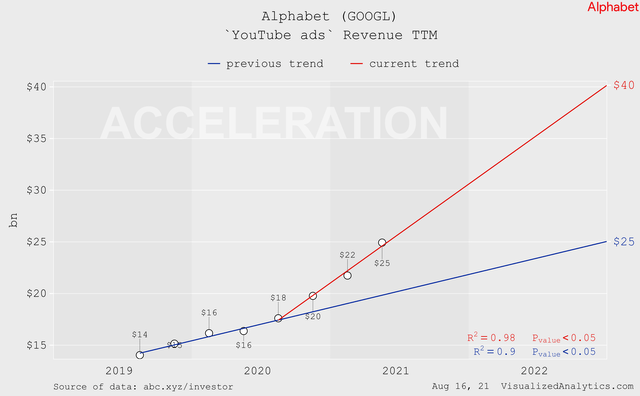
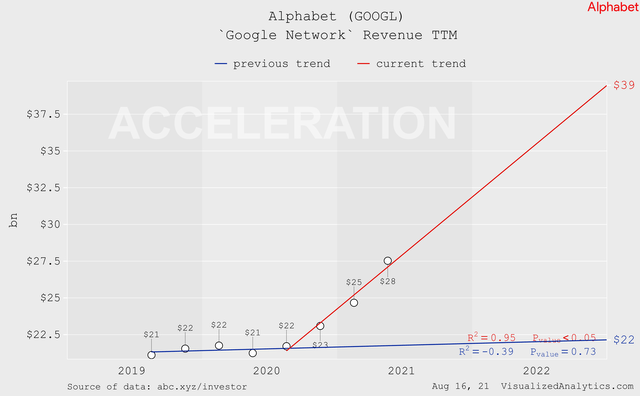
If we talk about revenue in general, then there is now an exponential growth. Moreover, the result of the last quarter turned out to be above the long-term trend:
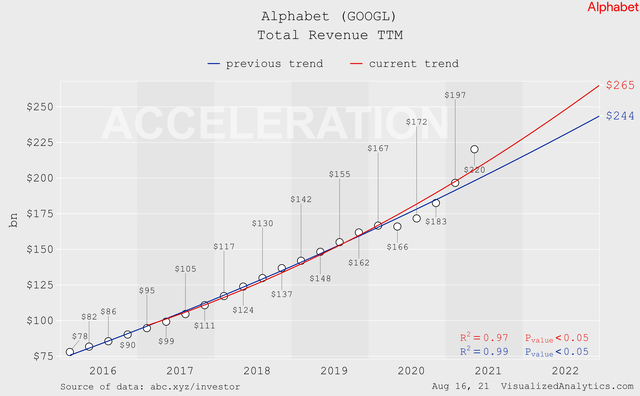
Of course, this is a consequence of the increased interest in digital advertising during the phase of the end of the coronavirus pandemic. Basically, this was the expected effect.
Market Cap vs Financial Results
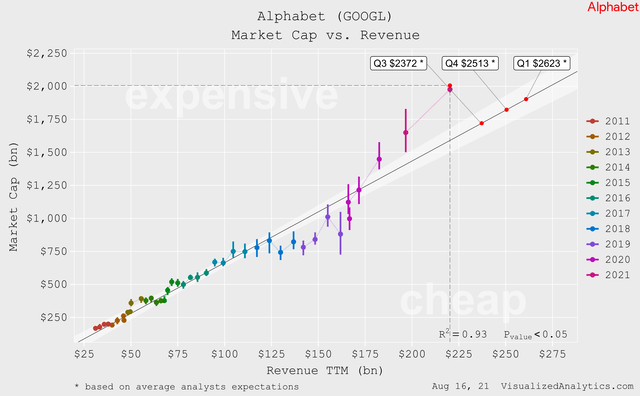
The most rough version of evaluating the current market price of a company is to analyze the mutual dynamics of changes in the size of capitalization and key operating indicators.
Over the last decade, Alphabet's capitalization has been in a qualitative linear relationship with its revenue TTM absolute size. And this relationship indicates an overvalued state of the company even in the context of the expected results of the next three quarters:
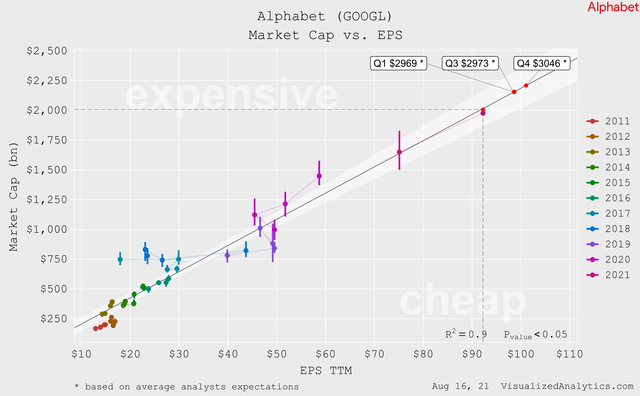
But in the case of EPS, Alphabet's current market cap is fairly balanced:
The relationship between capitalization and free cash flow turns out to be of the highest quality. And this relationship also confirms the balanced state of the company's current price:
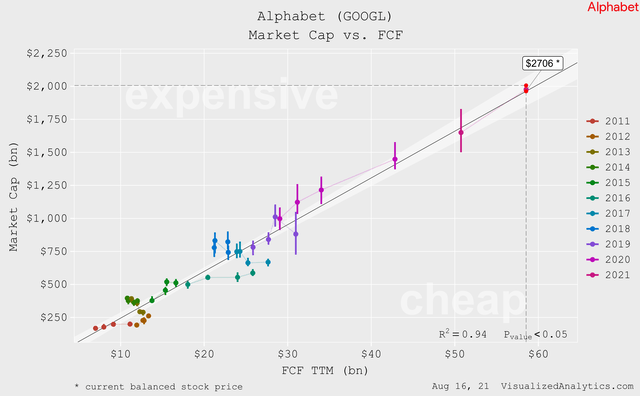
So, at first glance, given the growth of EPS and free cash flow, the company does not look expensive now. And this is impressive.
Comparative Valuation
Comparative analysis of Alphabet's multiples did not give an unambiguous result. But it revealed one characteristic detail, which should be discussed.
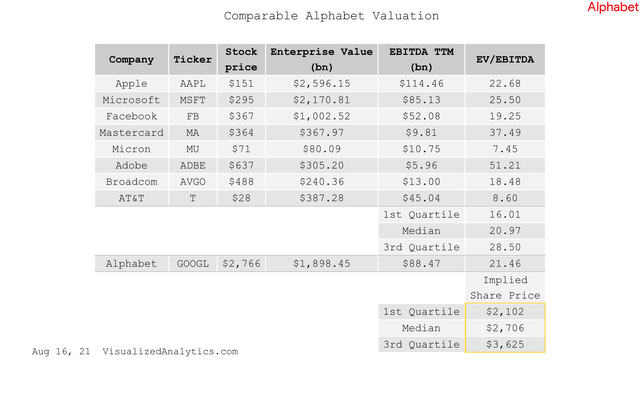
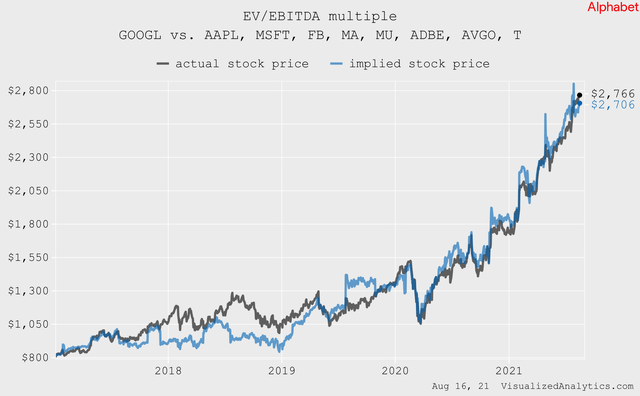
Comparing Alphabet to a broad sample of tech companies through historical multiples, it can be concluded that the company is in balance with the market.
This is indicated by the EV/EBITDA multiple:
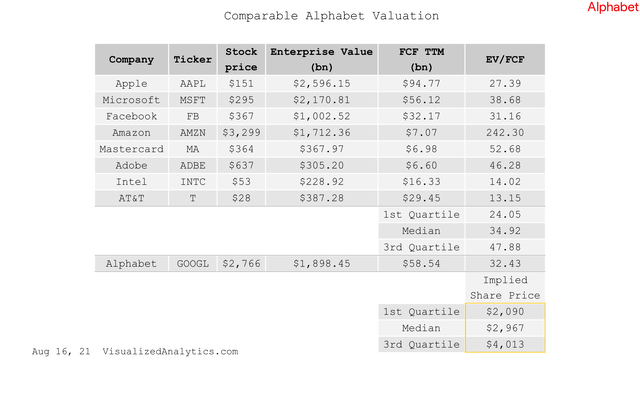
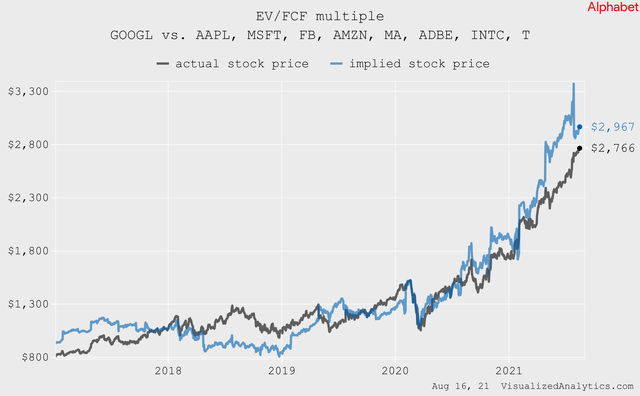
And the EV/FCF multiple:
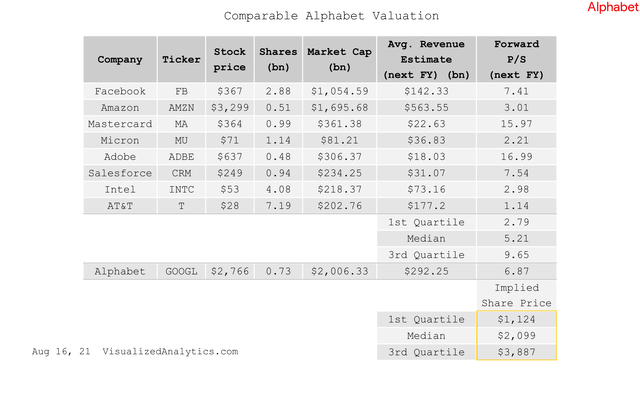
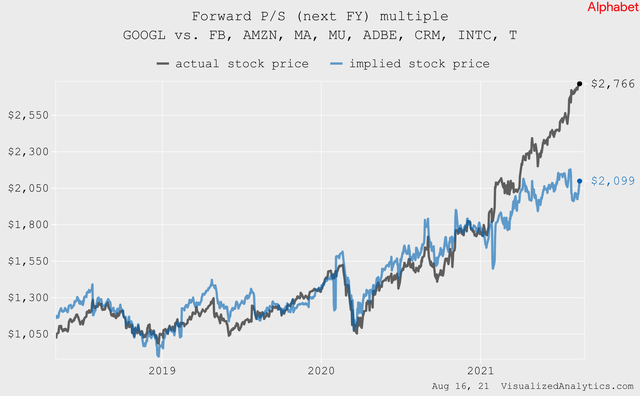
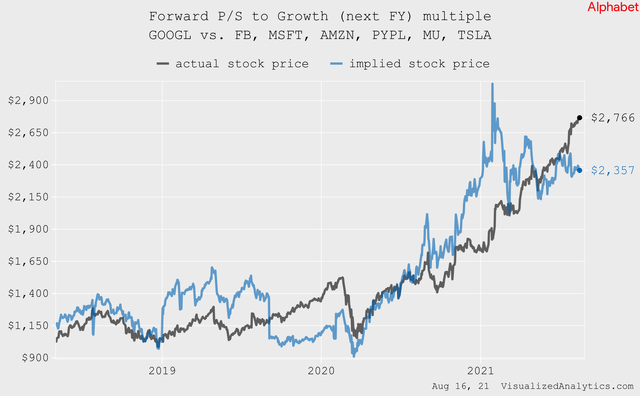
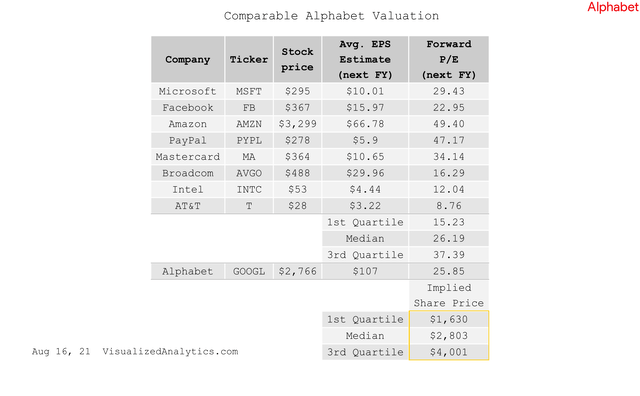
But if we turn to the forward multiples,they will not allow us to draw such a conclusion. So, judging by the Forward P/S (next FY) multiple, Alphabet is overvalued by 25%:
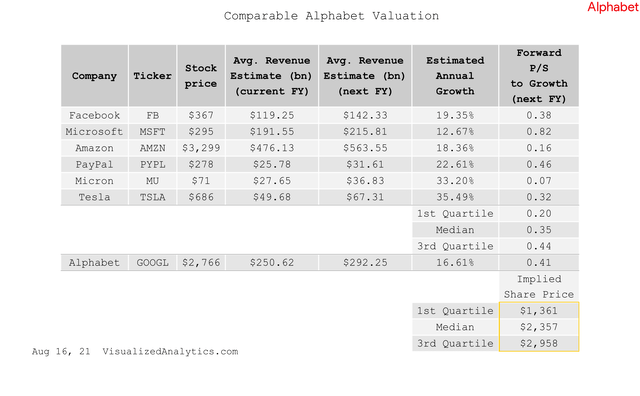
If we adjust this multiple for the expected growth rate, the result will not change much:
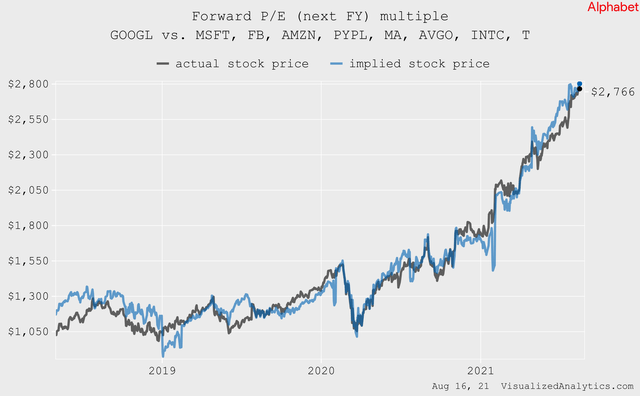
Judging by the forward P/E (next FY) multiple, Alphabet is balanced:
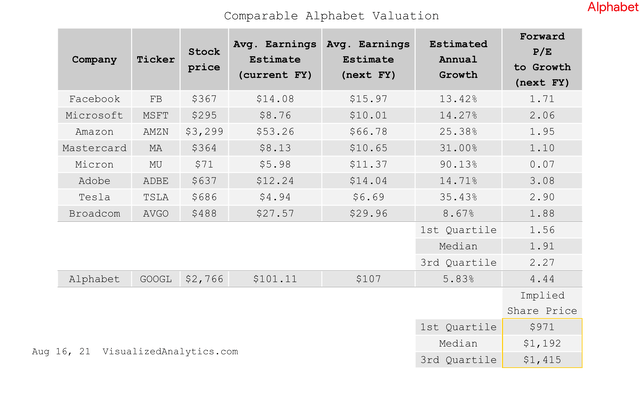
But, the growth-adjusted forward P/E multiple indicates overvaluation:
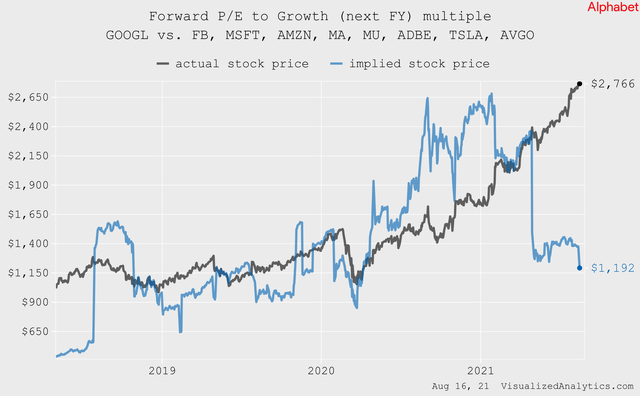
As you can see, if we compare Alphabet in the context of the current multiples, then the company is quite adequately assessed. But if you look at the forward multiples, and especially in the context of the expected growth rates of EPS and revenue, then the market is pulling Alphabet down.
Fundamental Valuation (DCF model)
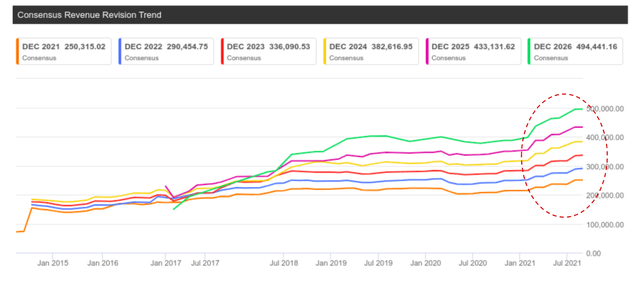
To forecast Alphabet's revenue for the next decade, I used the current averageestimatesof analysts. Importantly, sentiment about Alphabet's future growth has improved significantly this year:
Operating margins have also jumped recently:
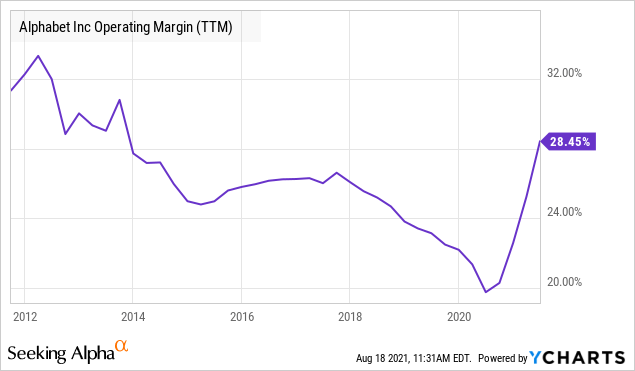
But the model is based on the assumption that the operating margin over the next 10 years will gradually decline from 26% to 21% in the terminal year. This is the standard approach, assuming increased competition in the industry.
Here is the calculation of the Weighted Average Cost of Capital:
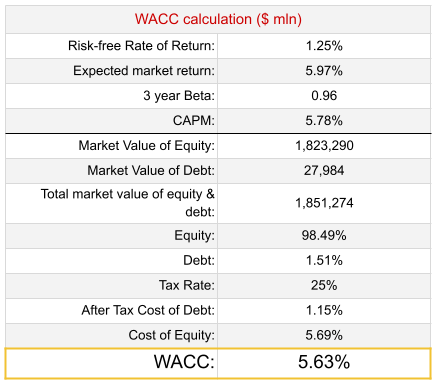
Some explanations:
- In order to calculate the market rate of return, I used values of equityriskpremium (4.72%) and the current yield of UST10 as a risk-free rate (1.25%).
- I used the currentvalueof the three-year beta coefficient. For the terminal year, I used Beta equal to 1.
- To calculate the Cost of Debt, I used the interest expense for 2019 and 2020 divided by the debt value for the same years.
When building the model, I used the following key assumptions:
- The relative size of CAPEX will be at the average of the previous six years (14%).
- The averagetax ratewill amount to 26%.
And, here's the model itself:
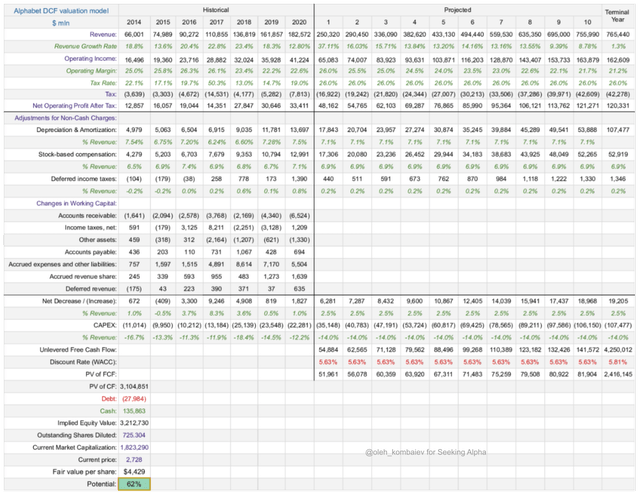
The DCF-based target price of Alphabet's shares is $4,430, offering ~62% upside. But, if we moderate the forecast for the operating margin and suppose that UST10 rises to 2%, then the growth potential drops to approximately 30%. This, however, is also a positive result.
Technical picture
Most stocks and indices follow their exponential trend, which tends to be well-identified on the graph with log y-axis. Let's take a look at Alphabet this way:
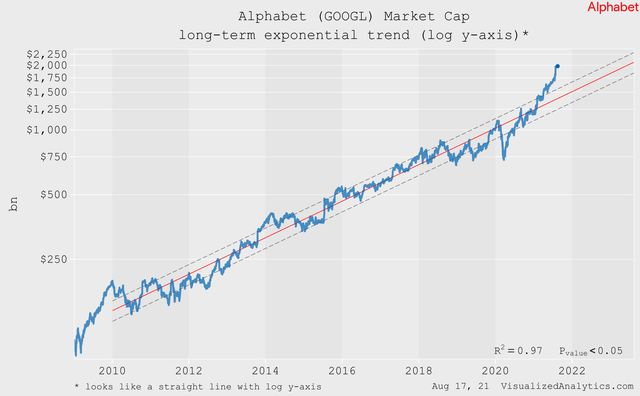
Starting from 2010, Alphabet's stock price had been following its long-term exponential trend. But now the company's stock price is above this trend by two standard deviations.It means that Alphabet's stock price is growing at a faster than exponential rate. Generally speaking, it indicates an unstable state.
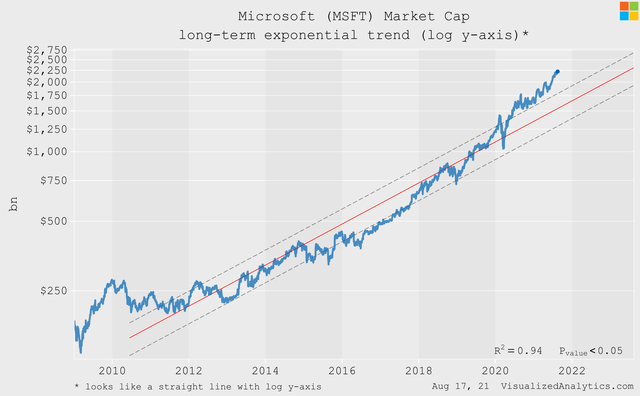
But, sometimes this is a signal that the price intends to grow in this way and further. A prime example is Microsoft (MSFT), which overtook its long-term exponential trend last year:
Dynamics of risks
The risks that will be discussed in this block do not relate to the company itself, but to the market as a whole.
The capitalization of Alphabet now accounts for about 4.3% of the capitalization of the entire US stock market. At the beginning of the year, this figure barely exceeded 3%:
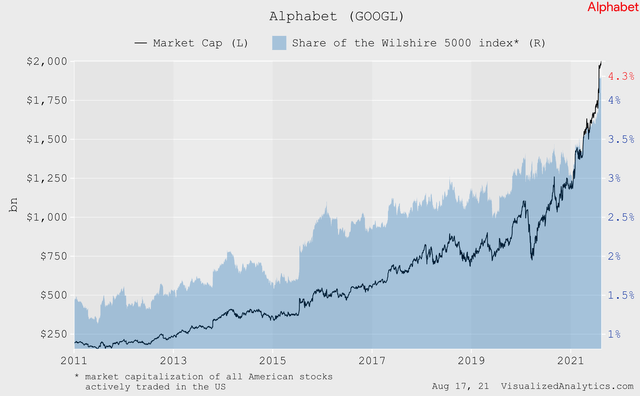
Only Apple (AAPL) and Microsoft have comparable shares...
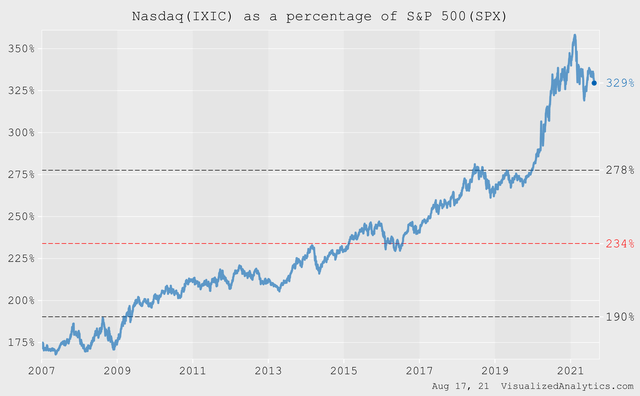
Further, over the past 14 years, the value of the Nasdaq index as a percentage of the S&P 500 index has grown from 175% to 330%. Moreover, the dynamics of the last few quarters suggest that this trend has reached a certain ceiling:
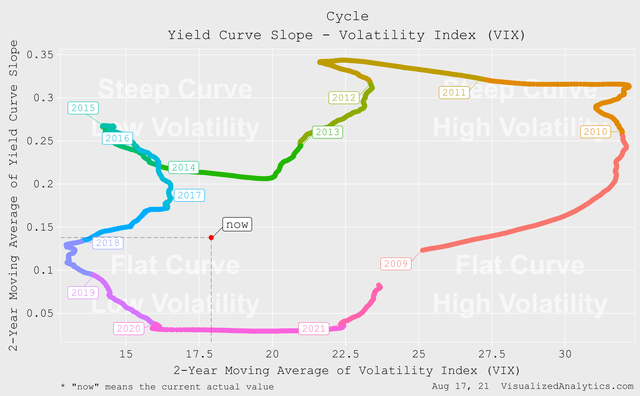
At the same time, microcycles allow us to expect that the market is entering a phase of increased volatility and tighter monetary policy:
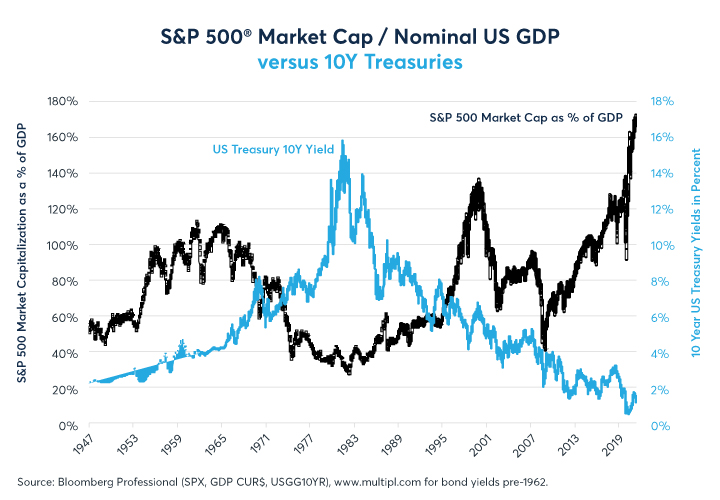
And it was the ultra-soft monetary policy that allowed the US stock market to reach its current record level relative to GDP:
In short, the current state of the market in many aspects has reached extreme points and this is a cause for concern.
Bottom line
Looking at the results that Alphabet has shown in the last two quarters, the company's current price is not surprising.
But the continuation of this growth at the same rates does not seem so obvious anymore. Especially with an eye to the general market situation and the expectation of a tightening of monetary policy in the US. On the whole, a neutral rating suggests itself.
精彩评论