
The list includes companies expected to achieve very rapid sales increases through 2023
Small-cap stocks have been rebounding as expectations grow for the post-pandemic economy.
Many may choose to ride that trend with large ETFs like the $68 billion iShares Russell 2000 ETF and the more-focused $67 billion iShares Core S&P Small Cap ETF.
But which make the most sense for stock pickers? The following screen emphasizes expected revenue increases and Wall Street analysts’ aggressive price targets.
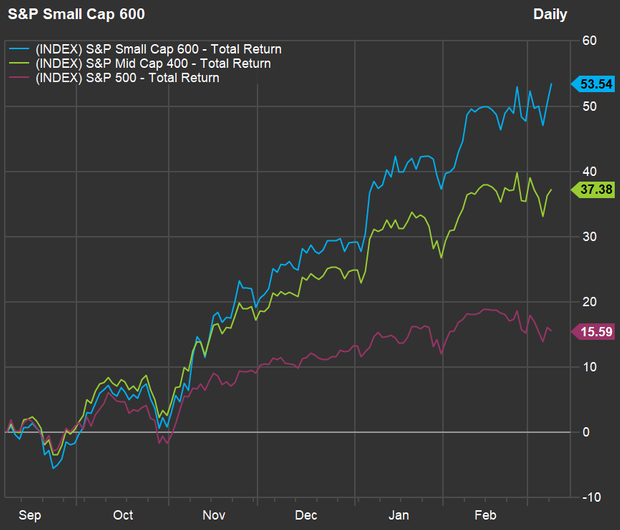
For starters, check out how well the S&P Small Cap 600 Index has performed over the past six months relative to the S&P 400 Mid Cap Index and the large-cap S&P 500:
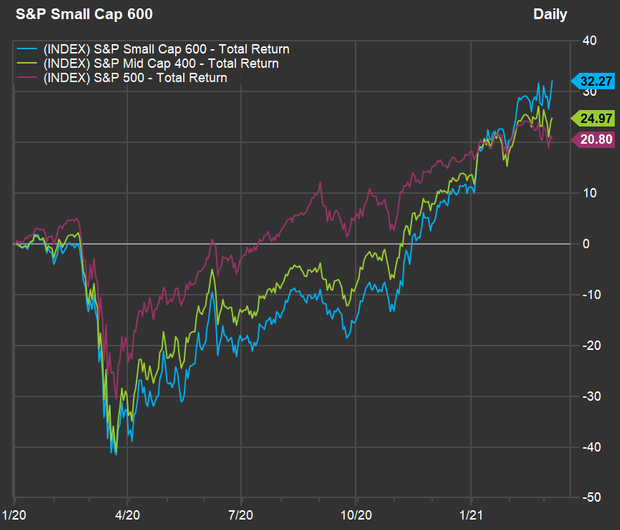
The small-cap fires are raging. If we look further back to the end of 2019, we can see how much worse the small-caps performed during the COVID-19 downturn in February and March 2020, when compared to the large-caps:
Small-cap companies tend to be much more domestically focused than large-caps. They may also be in industries that have been harshly affected by the pandemic, setting up rebound plays as sales recover. So the following list not only looks ahead over the next 12 months with analysts price targets but also takes sales estimates out through 2023.
Among the component of the S&P 500 index, there are 25 stocks that meet these criteria:
- Covered by at least five Wall Street analysts polled by FactSet.
- Majority “buy” or equivalent ratings among the analysts.
- Consensus revenue estimates available through calendar 2023.
- Expected three-year compounded annual growth rates (CAGR) for revenue of at least 15%.
The expected revenue growth rates will be of interest to longer-term investors. Other investors might be most interested in how well analysts expect the stocks to perform over the next year. So the list is ranked by implied 12-month upside potential based on consensus price targets:
| COMPANY | TICKER | INDUSTRY | EXPECTED SALES CAGR - THREE YEARS | SHARE "BUY" RATINGS | CLOSING PRICE - MARCH 8 | CONSENSUS PRICE TARGET | IMPLIED 12-MONTH UPSIDE POTENTIAL |
|---|---|---|---|---|---|---|---|
| COHU INC. | COHU | ELECTRONIC EQUIPMENT/INSTRUMENTS | 16.8% | 100% | $38.23 | $62.57 | 64% |
| LivePerson Inc. | LPSN | Internet Software/Services | 24.8% | 88% | $50.84 | $77.60 | 53% |
| Cutera Inc. | CUTR | Medical Specialties | 23.8% | 60% | $27.45 | $37.75 | 38% |
| Tactile Systems Technology Inc. | TCMD | Medical Specialties | 19.0% | 100% | $47.86 | $65.25 | 36% |
| MaxLinear Inc. | MXL | Semiconductors | 23.0% | 64% | $31.62 | $42.40 | 34% |
| eHealth Inc. | EHTH | Life/Health Insurance | 20.5% | 62% | $51.03 | $67.18 | 32% |
| Innovative Industrial Properties Inc. | IIPR | Real Estate Investment Trusts | 43.5% | 71% | $165.65 | $217.17 | 31% |
| Safehold Inc. | SAFE | Real Estate Investment Trusts | 27.9% | 62% | $69.47 | $90.57 | 30% |
| Xencor Inc. | XNCR | Biotechnology | 27.2% | 92% | $43.00 | $54.33 | 26% |
| AeroVironment Inc. | AVAV | Aerospace & Defense | 23.7% | 67% | $102.54 | $125.00 | 22% |
| Vicor Corp. | VICR | Electronic Components | 23.6% | 80% | $89.94 | $107.60 | 20% |
| Agree Realty Corp. | ADC | Real Estate Investment Trusts | 22.9% | 92% | $64.85 | $76.79 | 18% |
| Rent-A-Center Inc. | RCII | Finance/Rental/Leasing | 23.7% | 71% | $58.92 | $67.71 | 15% |
| Pacira Biosciences Inc. | PCRX | Pharmaceuticals | 17.3% | 57% | $70.57 | $80.46 | 14% |
| Monarch Casino & Resort Inc. | MCRI | Hotels/Resorts/Cruiselines | 27.7% | 100% | $63.09 | $71.40 | 13% |
| Omnicell Inc. | OMCL | Information Technology Services | 15.7% | 75% | $123.60 | $137.00 | 11% |
| Callaway Golf Co. | ELY | Recreational Products | 20.1% | 80% | $29.52 | $32.45 | 10% |
| Chefs' Warehouse Inc. | CHEF | Food Distributors | 17.8% | 60% | $32.16 | $34.40 | 7% |
| Summit Hotel Properties Inc. | INN | Real Estate Investment Trusts | 30.7% | 100% | $10.47 | $11.00 | 5% |
| Essential Properties Realty Trust Inc. | EPRT | Real Estate Development | 22.1% | 77% | $22.70 | $23.85 | 5% |
| Enova International Inc. | ENVA | Finance/Rental/Leasing | 25.7% | 80% | $36.49 | $37.75 | 3% |
| Bonanza Creek Energy Inc. | BCEI | Oil & Gas Production | 33.3% | 83% | $38.50 | $39.67 | 3% |
| Allegiant Travel Co. | ALGT | Airlines | 27.7% | 83% | $258.17 | $241.92 | -6% |
| Matador Resources Co. | MTDR | Oil & Gas Production | 20.3% | 60% | $25.17 | $23.27 | -8% |
| U.S. Silica Holdings Inc. | SLCA | Other Metals/Minerals | 15.8% | 60% | $14.62 | $13.40 | -8% |
FactSet
Scroll the table to see the expected sales growth rates and stock price targets.
The table only shows percentages of “buy” ratings because none of the stocks on the list have any “sell” ratings among analysts polled by FactSet, except for U.S. Silica Holdings Inc.,which is rated “buy” by three of five analysts, with one neutral rating and one “sell” rating. The company is one of three whose share prices are higher than the 12-month price targets.
The stock with the most aggressive consensus price target is Cohu Inc.,which makes testing equipment used by semiconductor manufacturers. The analysts expect this stock to climb 64% over the next year and for Cohu’s sales to grow at a CAGR of 16.8% through 2023.
Shares of Rent-A-Center Inc.RCII,+1.02%rose 7.5% on March 8, probably reflecting investors’ enthusiasm for the coming $1.9 trillion stimulus package, expected to be passed by Congress and signed into law by President Joe Biden as early as this week. Analysts see another 15% upside over the next 12 months and expect a sales CAGR of 23.7% over the next three years.
The company that analysts expect to boost revenue the fastest through 2023 is Innovative Industrial Properties Inc.,a real-estate investment trust that manages properties leased to licensed medical cannabis facilities in 17 states. Analysts expect a three-year CAGR of 43.5% for IIPR’s revenue and see 31% upside for the shares over the next 12 months.