
Here’s how to trade the stock market.
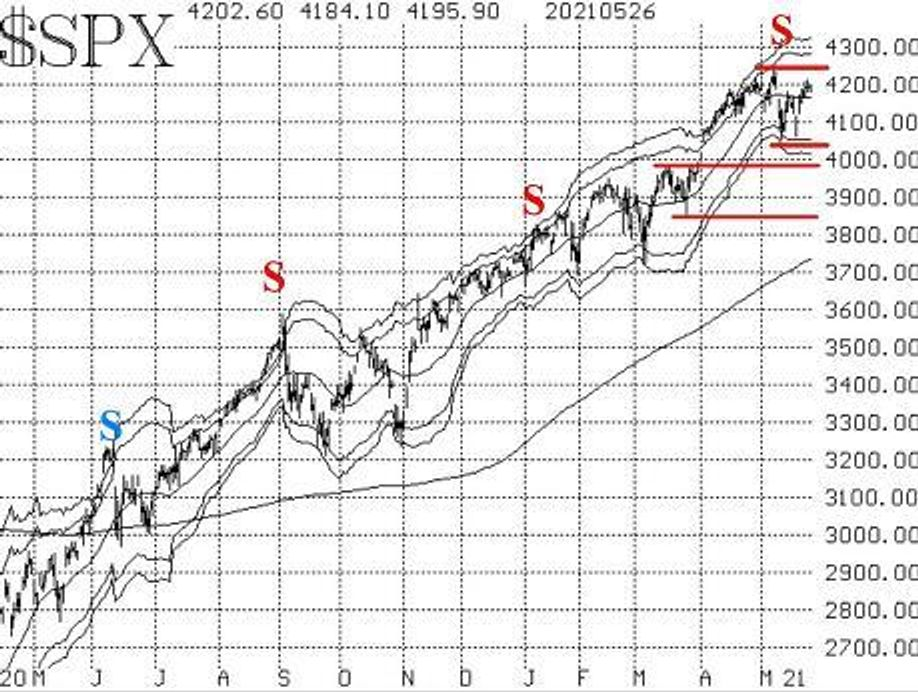
The S&P 500 index has been trading in a range between twice-tested support at 4060 and the all-time highs at 4238. As it nears the top of this range, a volatile move is likely to follow: Either it will break out to new all-time highs, which would certainly engender some strong follow-through buying, or it will fail at the top of the trading range and move lower to test the bottom of the range once again.
Either move is likely to be swift.
Let’s review the indicators, and then we can judge what strategy to apply to this theory.
As noted, the S&PSPX,+0.12%has resistance at 4238 (the all-time highs) and doubly-tested support at 4060. Below there, another support level exists at 4000, and then the support of last resort is at 3870.
A breakdown below 3870 would change things dramatically – turning the SPX decidedly bearish and most likely saying that we had entered a bear market. But that is far from current levels. In addition, the McMillan Volatility Band (MVB) sell signal is still in effect. Its target is the -4σ “modified Bollinger Band,” which is currently at 4020 and moving sideways.
Breadth has been jumping back and forth. There were breadth buy signals issued in mid-May, but breadth was not as strong during the rally as one might have hoped for. As a result, these breadth oscillators – while still on buy signals – are susceptible to a quick reversal to sell signals if breadth should register two consecutive negative days.
On a more positive note, though, there has been some internal strength during this rally, and the cumulative breadth indicators are improving. In fact,cumulative volume breadth(CVB) just registered a new all-time high.
Subscribers may recall that this is one of the few predictive things we can garner from cumulative indicators, and it portends a new all-time high in SPX will follow. The track record of this lone indicator has been very strong, in that it hasn’t been wrong in the 21 years we’ve tracked it (to be fair, there were no signals between the one in the year 2000 and the next one in 2013).
New 52-week highs continue to outnumber new 52-week lows. That is bullish. However, the number of new highs is no longer expanding as it once was. Regardless, this will remain a positive indicator as long as new highs outpace new lows.
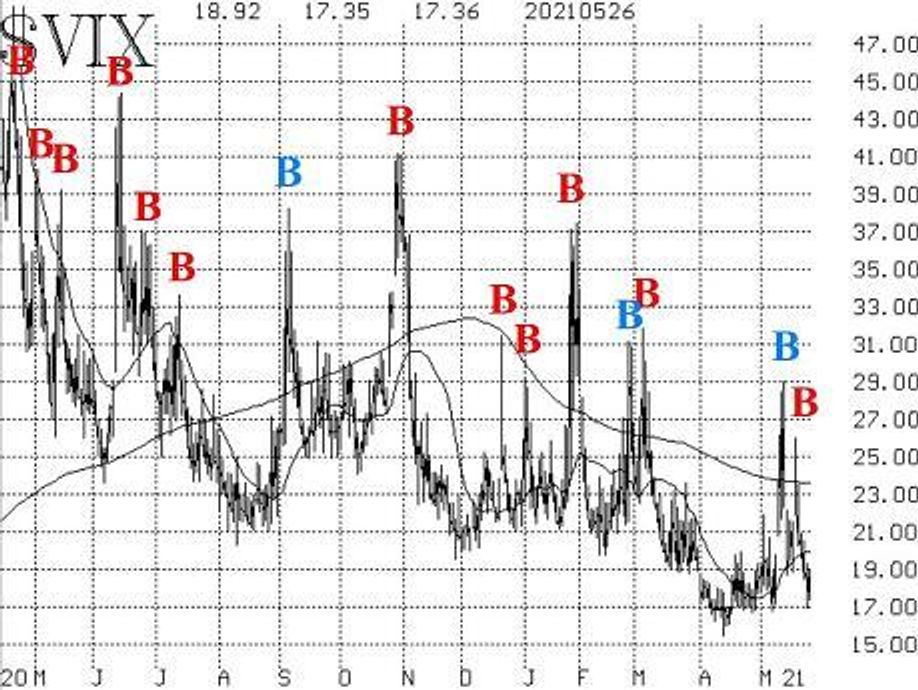
Volatility continues to be an area of analysis that is bullish in its outlook for stocks. First, the VIX “spike peak” buy signal remains in effect. Second, the trend of VIXVIX,-3.57%is clearly lower once again. VIX is below both is 200-day and 20-day moving verages. This is a slight change, because there had been a small uptrend development; that is no longer the case.
Finally, the construct of volatility derivatives remains positive in that the VIX futuresVX00,-4.61%are trading at premiums to VIX, and their term structure slopes upward. The Cboe Volatility Index term structure slopes upward as well.
New recommendation: SPY straddle buy
For now, SPX is still within a trading range between 4060 and 4238. One way to trade a range is to sell (short) near the top of the range and go long near the bottom of the range, reversing your position if a breakout occurs in either direction. In line with that strategy, one would be buying puts now, with SPX near the top of the range.
However, as we saw in the above analysis, there are currently both positive and negative indicators, with one of the stronger ones being the CVB buy signal. With that in mind, one would buy calls, looking for SPX to eventually break out to new highs. Throw in the fact that volatility (VIX) is near its lows, and straddle purchase seems to be the strategy to take advantage of all of these factors.
Buy 1 SPY July (16th) at-the-money call
And buy 1 SPY July (16th) at-the-money put
Currently that at-the-money straddle costs about 17 points, or $1,700. It would make money, then, if SPY rose 17 points above the striking price or fell 17 points below.
New recommendation: Cerner
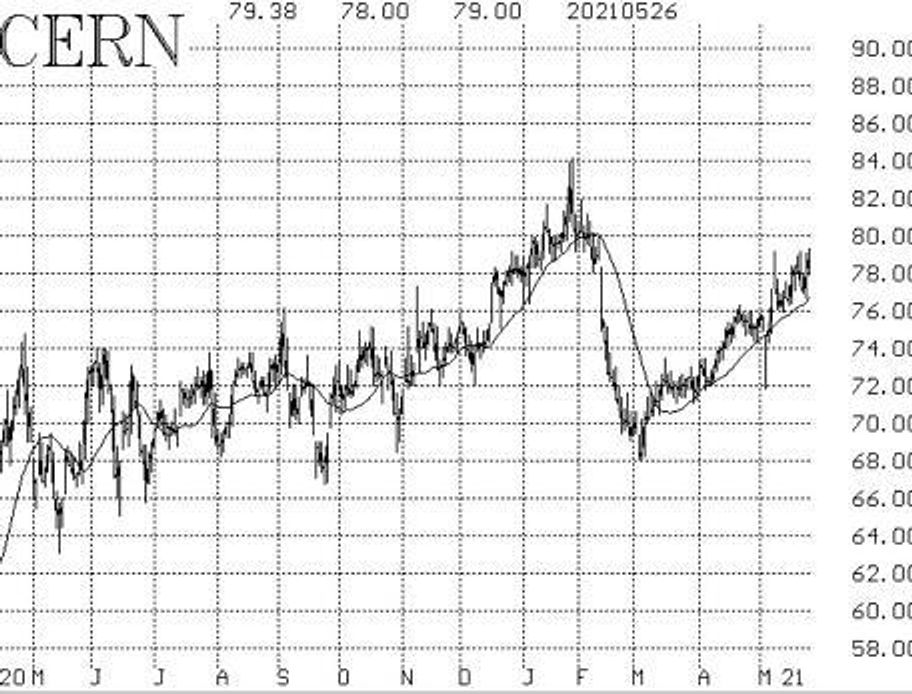
Vague takeover rumors have sprung up in CernerCERN,-0.94%over the past two days. Option volume is running about triple is usually pace over that time. Stock volume patterns are quite strong, and there is support for the stock in the 76-77 area.
Buy 4 CERN June (18th) 80 calls
At a price of 2.00 or less.
CERN: 79.03 June (18th) 80 call: 1.95 offered
All stops are mental closing stops unless otherwise noted.
Long 8 FXY Jun (18th) 87 calls:Sell these calls now, since the put-call ratio buy signal is no longer in place.
Long 2 SPY June (11th) 410 puts and short 2 SPY June (11th) 385 puts:This trade was taken because of the MVB sell signal that occurred, when SPX traded down through 4105 on May 12. It would be stopped out by SPX once again closing above the +4σ Band. Effectively, at this point we are holding without a stop. It would reach its profit target if SPX trades at the -4σ Band. Right now, the lower Band is at about 4020 and moving sideways. Sell half of this position if SPX trades at 4000 at any time.
Long 1 expiring SPY May (28th) 416 put and short 1 SPY May (28th) 396 put:This recommendation is based on the equity-only put-call ratio sell signal that is in place. We will hold this recommendation as long as the equity-only put-call ratios are on sell signals. Hence, we will be updating the status weekly. Since the spread is expiring, sell the current spread and replace it with the following:
Buy 1 SPY June (18th) at-the-money put
And sell 1 SPY June (18th) put with a striking price 20 points lower.
For now, hold without a stop. Roll the position down, 20 strikes on each side, if SPYtradesat the lower strike at any time.
Long 3 DUK June (18th) 100 calls:Hold without a stop while we wait for the activist investor to produce a positive result.
Long 2 SPY June (18th) 415 calls and short 2 SPY June (18th) 428 calls:This spread was bought when the most recent VIX “spike peak” buy signal was confirmed on May 21. It would be stopped out if VIX were to return to spiking mode – that is, if it rose at least 3.00 points over any period of three days or less (using closing prices).
Long 1 KSU Jun (18th) 300 call:Kansas City SouthernKSU,+0.81%has formally accepted the higher takeover bid from Canadian National RailwayCNI,+2.82%.CNI stock has dropped a little, but the deal is still worth $315. The deal is for $200 cash + 1.129 shares of CNI. Of course, there are regulatory delays. However, the spread in the deal widened and option prices fell, which seems like overkill. When the higher bid was first made on May 14, Canadian National was trading at 107 and now it’s at 104 – hardly much of a difference. We are going to hold and see if this spread can tighten somewhat. It is unclear whether or not Canadian Pacific RailwayCP,-1.10%– the other bidder – will come back with a superior offer. It seems like the option market is saying “no.”