
If you use the 200-day moving average as a buy/sell signal in your trading, you need to be aware of what just happened today.
We've talked about market breadth a lot over the past few months. With mega-cap growth names still providing market leadership, the S&P 500 level is masking some of the underlying market weakness below the surface. The benchmark index is still trading about 5% above its 200-day moving average, but the average component doesn't look nearly as bullish.
For the first time since September of last year, fewer than half of S&P 500 components are trading above their 200-day moving average.
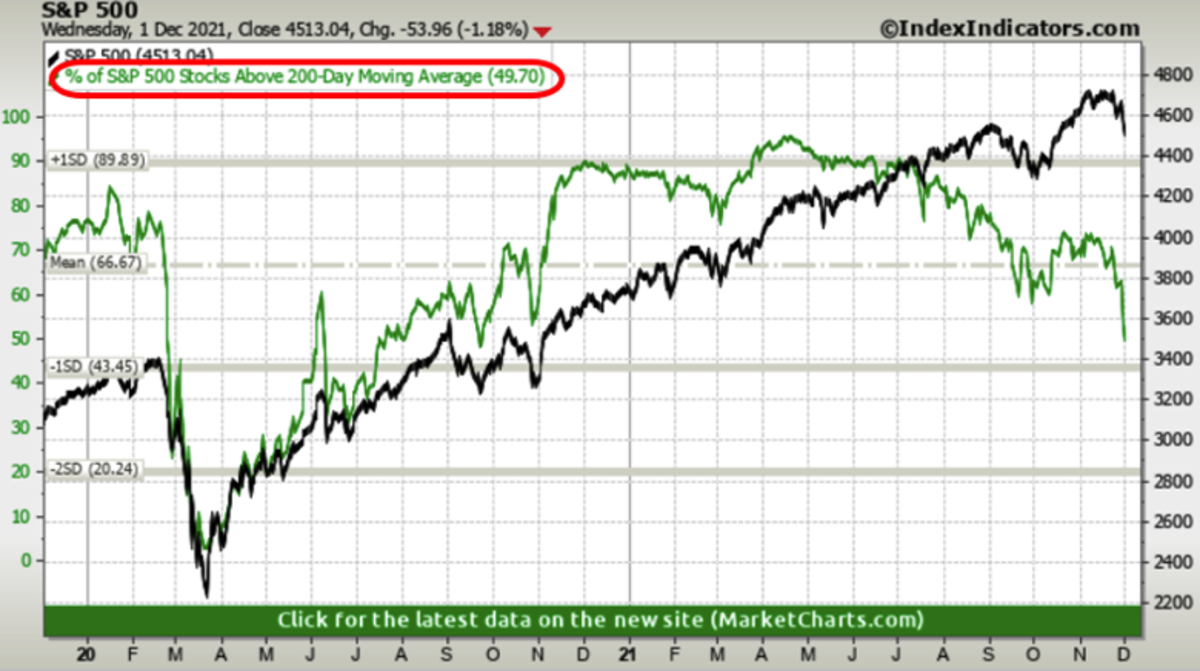
The market's been heading in this direction throughout November and now into December. Less than a month ago, roughly 65-70% of components were trading above their 200DMA as the S&P 500 was at all-time highs. Breadth began weakening even before the index moved off of its highs and I suspect this number will move well into the 40s and maybe even the 30s over the next several trading days.
Other confirming signals that the market could get weaker - strength in Treasuries, outperformance in utilities and underperformance in small-caps.