
The stock market continues to be led by the Dow Jones Industrial Average,with NASDAQ lagging noticeably behind, and the S&P 500 indexcaught somewhere in the middle. This is not a good scenario for stocks.
There is an old adage that it is not good for the market if the Generals are out in front of the Army (the “Generals” being General Motors, General Electric, etc. – i.e., the mainstays of the Dow of days gone by; the “Army” being the main body of stocks). The point is that if the advance is narrow and limited to the largest institutional stocks, then trouble lies ahead.
It is a good point, but too vague to implement as a trading system. We would normally see that reflected in breadth (which is now giving a sell signal) and new highs vs. new lows (which is also on a sell signal).
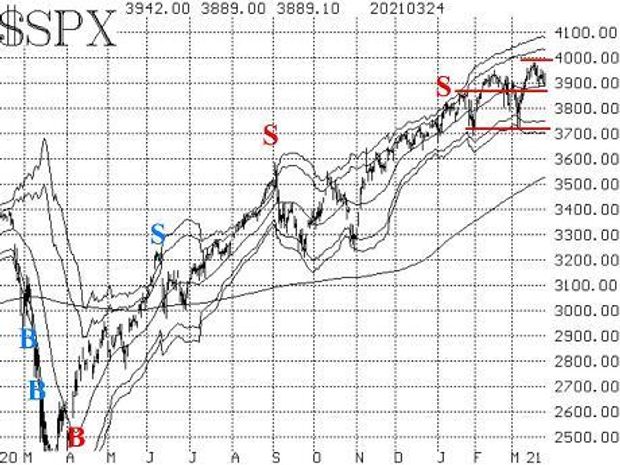
One positive thing is that the SPX chart is still in an uptrend, as the moving averages and “modified Bollinger Bands” are still trending higher. However, if the S&P breaks through support at 3,870, that uptrend would be called into question. As one can see from the accompanying chart, there is further support near 3,725. If that is broken, the bears would clearly be in charge. Meanwhile, the recent all-time highs, at 3,985, represent resistance.
What is different today compared to previous minor pullbacks is that several of our internal indicators have weakened considerably and are on sell signals: breadth, new highs vs. new lows, and equity-only put-call ratios.
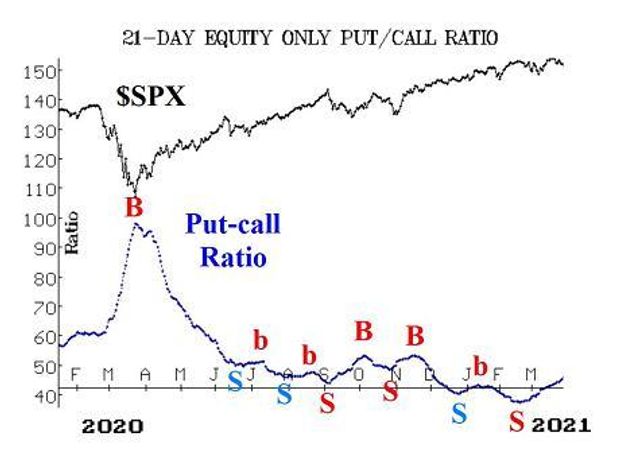
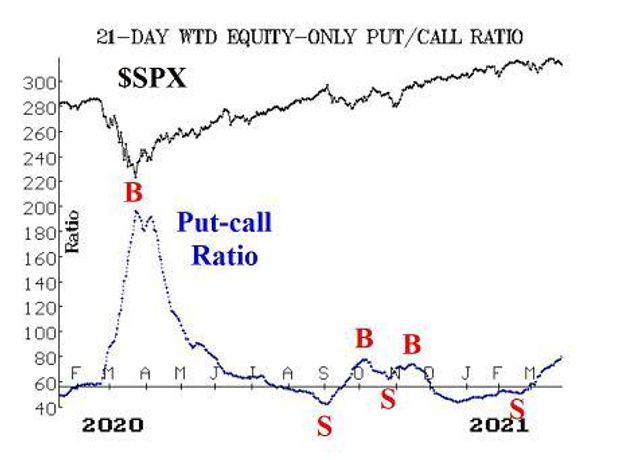
Equity-only put-call ratios remain on sell signals that were first generated in mid-February and that have strengthened by beginning to rise rapidly. They are still relatively low on their charts, meaning that there is a lot of room to move higher before one might say they are “oversold.”
Breadth has deteriorated badly over the past two weeks – especially this last week. Sell signals were generated by the breadth oscillators on March 18 and March 19, and those oscillators have plunged since then. The “stocks only” breadth oscillator has already descended into oversold territory, but “oversold doesn’t mean buy.”
The NYSE breadth oscillator is also moving lower, but at a much slower pace, since the more positive “Dow-type” stocks have a heavier weight in that oscillator.
Meanwhile, cumulative breadth has fallen sharply as well. That is not a signal, but it is worth noting that the “stocks only” cumulative advance-decline line has fallen almost 10,000 issues since the cumulative A-D line reached an all-time high on March 15 (that is, over that time, summing the daily figures, declines have outnumbered advances by 10,000 issues).
A significant development has also occurred in the case of the “new highs vs. new lows” indicator. On March 23, new 52-week lows outnumbered new 52-week highs andnew 52-week lows numbered more than 100 issues — the first time that has happened since last May. That was the case again on March 24. That places this indicator on a sell signal until new highs take control once again.
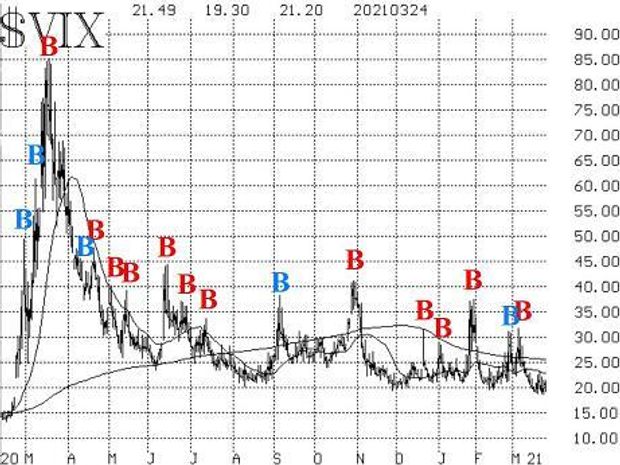
Countering the negativity of put-call ratios, breadth, and new highs vs. new lows, is the fact that the volatility indicators still remain generally bullish. VIX has not risen substantially (yet), so the “spike peak” buy signal of March 4 remains in place.
Moreover, the trend of VIXVIX,-6.56%continues to be lower, as both VIX and its 20-day moving average are below the declining 200-day moving average. In fact, on March 22, VIX closed at its lowest price (18.88) since February 2020.
If VIX should continue to fall below there, it would be a bullish sign for stocks.
As we’ve noted previously, the fact that VIX has remained so high all during the huge rally over the past year has been a worrisome sign for many traders. But the traders that were keeping VIX higher were actually correct, because realized volatility of SPX (i.e., its 20-day historical volatility) has been just below 20 since early March. Thus, realized volatility rose to meet implied volatility, rather than the other way around (which is more often the case).
Now, if one wants to make the case that it is worrisome to see both forms of volatility this high, then so be it. But there is no longer any significant difference between the S&P’s realized and implied volatility.
The construct of volatility derivatives has remained bullish throughout. VIX futures are all trading at premiums to VIX, and the term structure slopes upward through the coming summer. Similarly, the term structure of the CBOE Volatility Indices slopes upward through the next six months as well.
The first sign of a negative reversal here would be if the April VIX futures traded above the price of May VIX futures.
Near-term deterioration in some internal indicators is certainly a cause for worry, and small countertrend bearish positions can be taken because of that. However, the S&P’s trend is still higher, and the trend of VIX is still lower – both bullish factors. So we still maintaining a “core” bullish position until those two trends are broken.