
The stock market is entering the danger zone, according to one often overlooked measure of equities valuation.
At its current level of 38 times, the Shiller P/E Ratio is nearing the peak (44 times) seen at the height just before the dot-com bust in 2000, write strategists atSunDial Capital Research. Created by noted Yale professor Robert Shiller, the ratio is seen as better than the traditional P/E ratio as it adjusts for inflation.
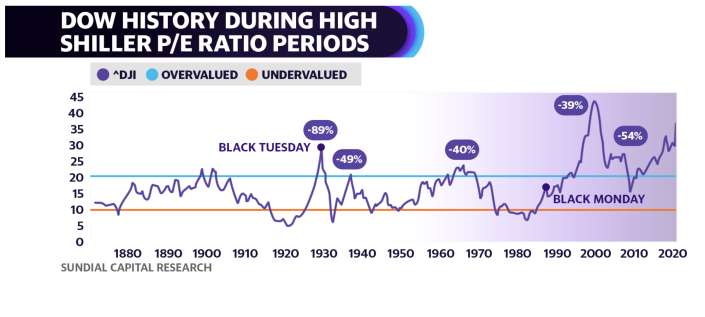
Historically, a Shiller PE ratio sustained over 25 times has gone on to be a precursor for sizable pullbacks in the market as presented in the below chart by Sundial Capital Research.
The team at Sundial is quick to point out that no stock market measure is fool proof or all predictive.
"That the stock market is 'overvalued' DOES NOT mean investors need to take drastic action immediately. Because the reality is that the stock market can (and, in fact, has been) overvalued for many years," explains Sundial.
The group added, "The current high reading for the Shiller P/E is NOT a 'call to action.' It is more of a 'call to pay close attention.' There are always 'things' to be concerned about that may upset the apple cart."
In other words, don't sell all your stocks and hide the cash under your bed.
That said if you aren't inclined to be a big believer in the Shiller P/E Ratio (count my colleagueMyles Udlandin that camp,watch videoabove), perhaps a closely watched measure by theWarren "Oracle of Omaha" Buffettis more in lockstep with your analytical views.
The “Buffett Indicator” as it’s called in Wall Street circles — which takes the Wilshire 5000 Index (viewed as the total stock market) and divides it by the annual U.S. GDP — is still seemingly hitting new record highs daily. In crunching the numbers, the Buffett Indicator stands at about 204.4% — up sharply from the 187.5% level (also a record) from when we last wrote about the measure in late February. All data comes to us fromGuruFocus, which extensively tracks the indicator.
The existing figure remains well above the 159.2% seen just before the dot-com bubble.
“The stock market is significantly overvalued according to the Buffett Indicator,” said the researchers at GuruFocus. “Based on the historical ratio of total market cap over GDP (the aforementioned 204.4%), it is likely to return -3.3% a year from this level of valuation, including dividends.”
The Buffett Indicator rose to fame after a2001 Fortune Magazine articlewritten by Buffett and long-time Fortune writer and Buffett insider Carol Loomis.
“The ratio has certain limitations in telling you what you need to know. Still, it is probably the best single measure of where valuations stand at any given moment,” explained Buffett in the article.