CRUDE OIL PRICE OUTLOOK:
- Oil prices trade steadily on Wednesdayafter falling 4.7% earlier this week
- US crude inventories felllessthan expected last week,exerting downward pressure on prices
- Heightened Covid-related travel restrictions in Chinamay cast a shadow over the demand outlook
Crude oil prices held steady during Wednesday’s APAC session after falling 4.7% over the last two days. A rapid Covid-19 flareup in China cast a shadow over its growth outlook amid an already slowing economy. Authorities have reported 353 locally transmitted cases since July 20, with the highly contagious Delta variant found in more half of China’s 32 provinces. Over 46 mainland cities have warned against non-essential travel and conducted mass-testing for the virus to curb its spread.
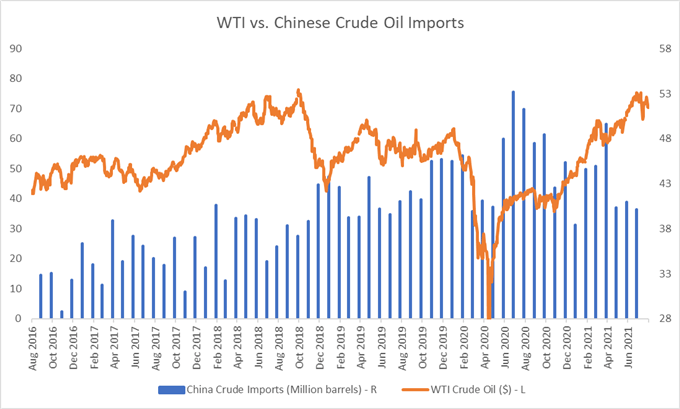
Stricter mobility constraints may dampen the energy demand for the world’s largest oil-importing country. China accounts for around 26% of the world’s total crude imports, with over 40 million barrels imported monthly so far in 2021 (chart below).
Meanwhile, the America Petroleum Institute (API) reported a smaller-than-expected draw in crude inventories for the week ending July 30th, undermining energy prices. Crude oil stocks fell 0.88 million barrels, compared to an estimated 2.90-million-barrel drop. Traders will monitor the EIA’sweekly petroleum status report– the official data for crude and gasoline inventories – for more clues about changes in supply-demand dynamics.
WTI vs. Chinese Crude Oil Imports – Last 5 Years
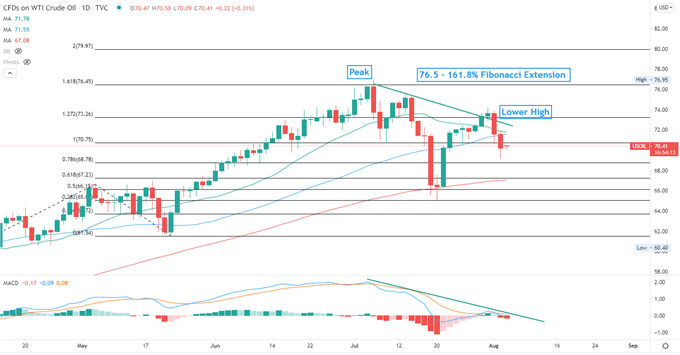
Technically, WTI entered a technical pullback after hitting a two-and-half year high of $76.95 on July 6th (chart below). Prices have since formed consecutive lower highs and lower lows, suggesting that near-term trend may have flipped downward. An immediate support level can be found at around $70.00 – a psychological level, and then $68.80 – the 78.6% Fibonacci extension. An immediate resistance level can be found at $73.26 – the 127.2% Fibonacci extension.
The MACD indicator is trending lower, suggesting downward momentum may be dominating.
WTI Crude Oil Price–Daily Chart