
Tilray Inc.(NASDAQ:TLRY) shares jumped Monday after the company announced it willhold a meetingto approve the proposed Tilray-Aphria Inc(NASDAQ:APHA) business combination.
The meeting will be held Friday, April 16.
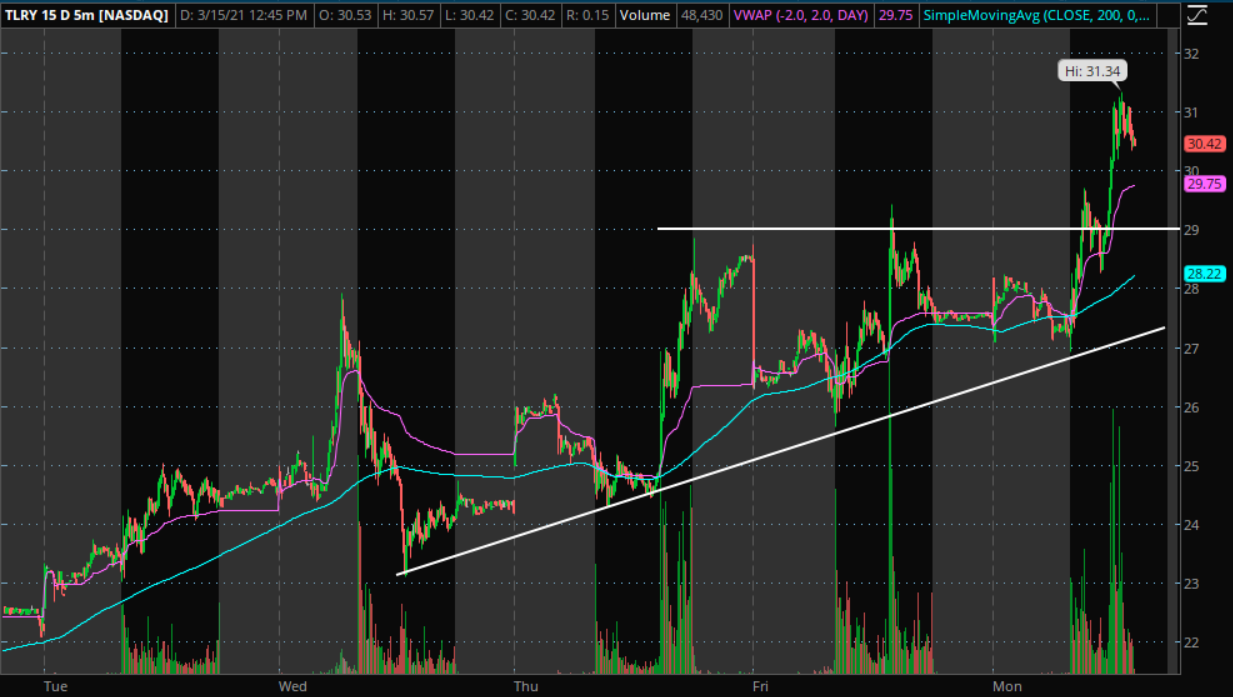
This triangle pattern showed higher lows building up to a resistance level of $29. This level was broken and now may hold as a potential support level in the future.
The stock has also been holding the 200-day moving average (blue) and VWAP (pink) as support. As long as those levels are held, the stock may still be considered bullish on the day.
Short-term bullish traders may like to see the stock consolidate with a retest of resistance now as support before a further upward move. The bears would like to see the stock stop forming higher lows and fail when attempting to retest the $29 area as support.
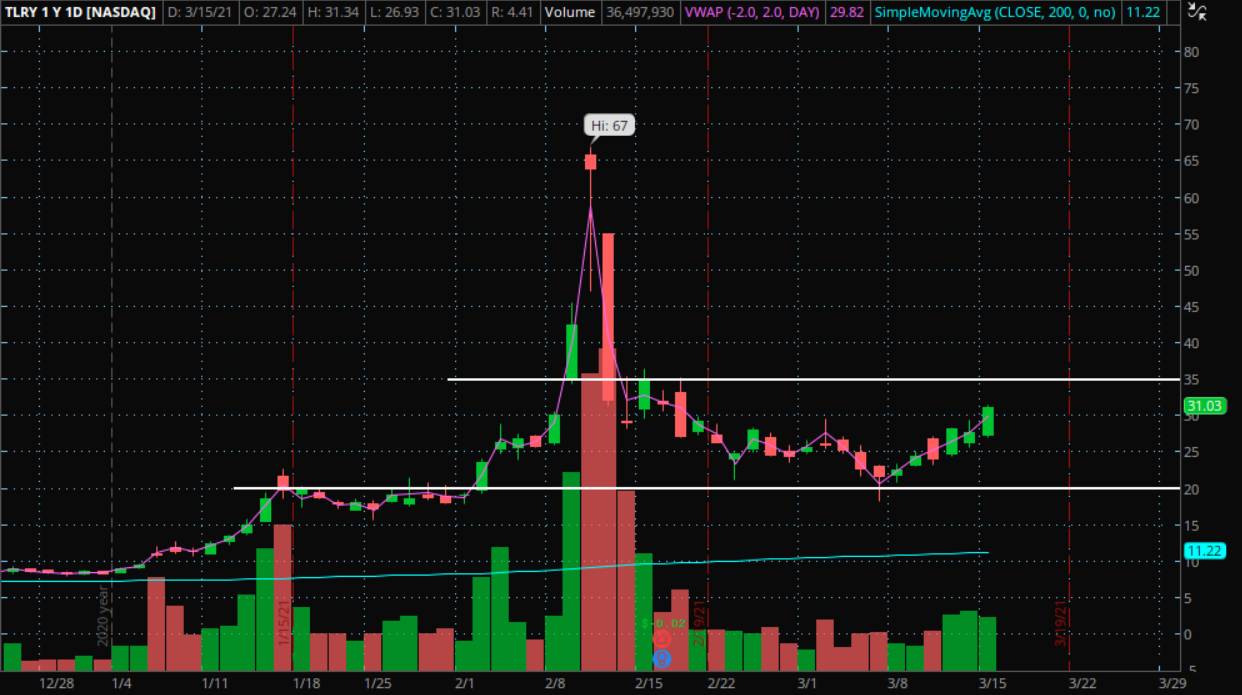
Bulls would like to see the resistance level break with some consolidation before the price may go higher up.
Bears would like to see the opposite occur with a support level break and consolidation before the price may go lower.
Tilray is trading with a market cap of $4.8 billion and a public float of 143.8 million shares.