
Amazon stock’s valuations still look rich on the surface. But compared to history, the multiples sit near multi-year lows. Could this be a good time to buy and hold shares?
Amazon stock has been having a choppy 2021 so far. Shares have managed to stay (barely) in the green for the year, but the zigzagging has been stomach-churning for investors. In the past five trading days alone, the stock has been down about 7%,following a disappointing Q2 earnings report.
The better news is that a stale share price coupled with improving financial performance (e.g. robust growth in revenue, earnings and cash flow) have led to lower valuations. Today, the Amazon Maven shows how AMZN, a traditionally pricy stock, is currently valued near a multi-year trough.
A closer look at valuations
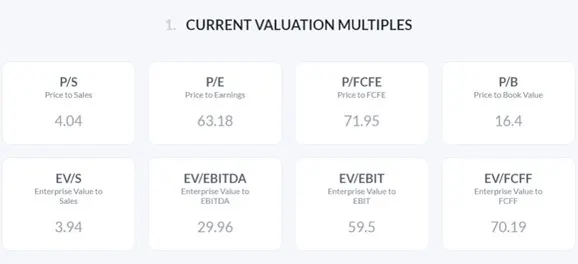
The table below, provided by Alpha Spread, summarizes Amazon’s key relative valuation multiples.
On the surface, the stock continues to look expensive, certainly to value investors. Price-to-sales of 4 times is quite rich for a company with modest margins, and so is trailing price-to-earnings ratio of 63 times – the S&P 500 trades at a P/E of nearly half this much, at around 33 times.
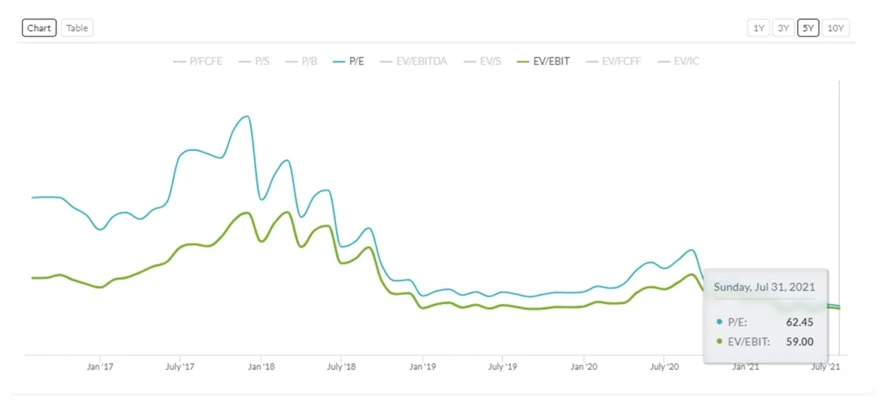
But relative to Amazon stock’s own history, these metrics are far from stretched today. The chart below shows how P/E and EV/EBIT, two important P&L-related valuation metrics, currently sit very much at five-year lows.
Better yet, the two figures are based on trailing results. Look forward, and the multiples look even more enticing. For example:according to Seeking Alpha, analysts expect Amazon’s EPS to rise to over $160 by 2025. At those levels, and assuming today’s stock price, the five-year forward P/E is only 20 times. Not bad at all for the stock of a market-dominant, high-growth company.
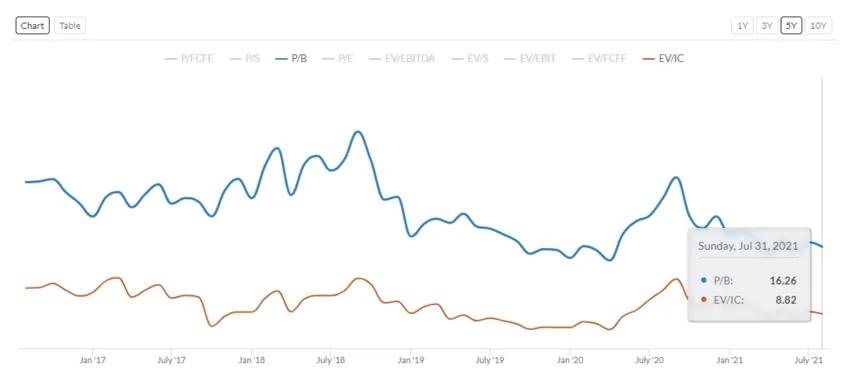
Outside the income statement, other valuation metrics also tell a similar story. For instance, price-to-book ratio of 16 times is the lowest in five years at least (see chart below), other than during the most intense few weeks of the COVID-19 bear.
Enterprise value-to-invested capital of 9 times is off the lows of 2020 and late 2019. However, the metric currently sits only two turns away from the ten-year minimum of 7 times reached in 2014.
The Amazon Maven’s take
The graphs and tables above support the bullish views that the Amazon Maven has proposed since the company’s Q2 earnings release:
“On one hand, momentum traders will likely want to keep some distance from AMZN, now that e-commerce is expected to decelerate in a post-pandemic environment. On the other hand, investors might want to take advantage of the dip to accumulate shares. The Amazon Maven has published its research on the best time to buy Amazon, and the evidence is clear: doing so after pullbacks tends to result in better forward one-year returns.”