
It was a good year for the Dow Jones Industrial Average overall, which gained more than 18% in 2021. But not all stocks performed that well. Let's look at the losers.
The Dow Jones Industrial Average had a pretty good year, rising about 18.75% in 2021. The recent run to record highs certainly helped its year-end tally.
While better than its long-term average, the index lagged the S&P 500 and Nasdaq, which climbed 27.1% and 22% this year, respectively.
The Dow did outperform the Russell 2000’s 13.9% return, though.
In 2021, the Dow’s worst-performing stocks were Disney, Verizon, Boeing, Merck and Honeywell, in that order.
I want to know if these stocks can make a recovery in 2022, so let’s look at the charts.
Trading Disney Stock
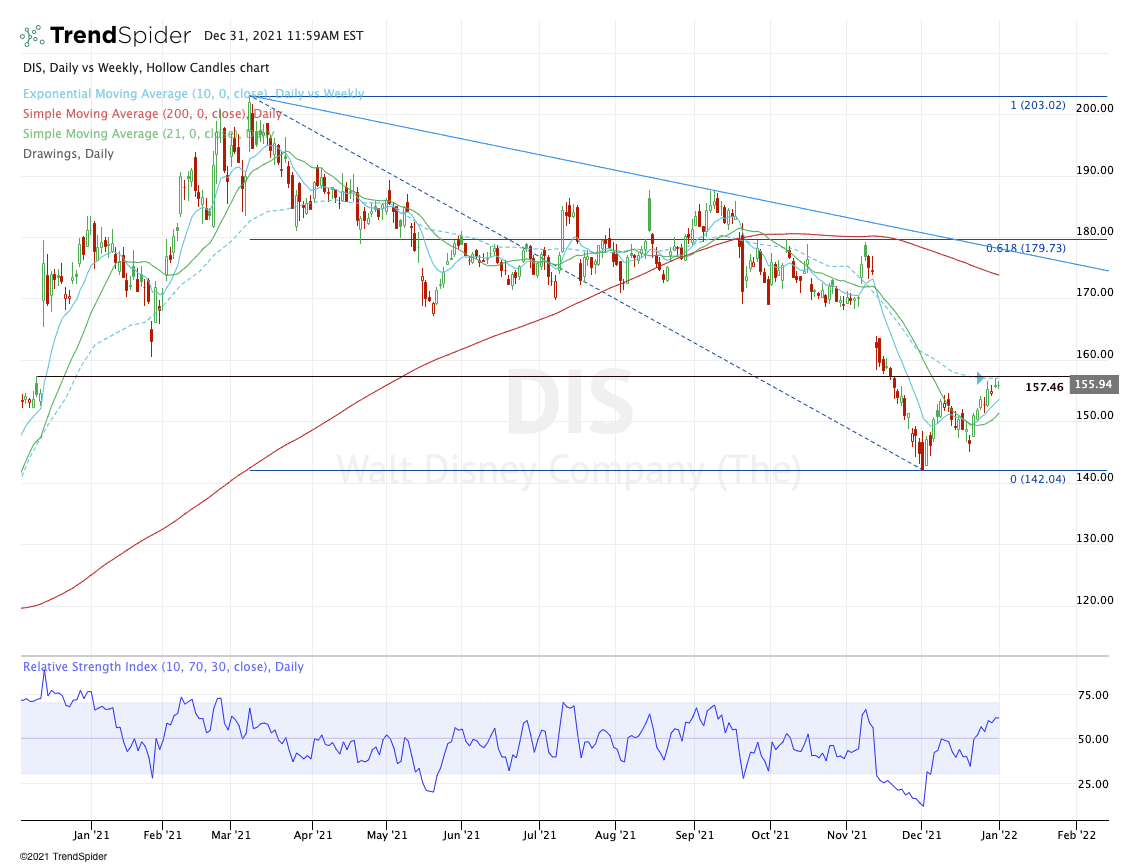
Disney was the worst-performer in the index, down 14% in 2021.
The stock went through a pretty rough stretch in the fourth quarter, falling in 13 of 16 sessions. The three “up days” in that stretch were gains of 0.25%, 0.10% and 0.21%.
Essentially, pauses before the next breakdown.Earnings didn’t help matters either.
Now the company is looking to dominate the box office in 2022 and it’s got investor shoping the stock is a dominant force next year too.
Disney is off to a good start, all things considered.
It’s putting in a higher lowanda higher high. Now contending with the 10-week moving average and the prior gap-fill level near $157.50, bulls are looking for a continuation to the upside.
If they get it, bulls will no doubt be looking for a move to fill the gap from November near $174 and a tag of the 200-day moving average.
Trading Verizon Stock
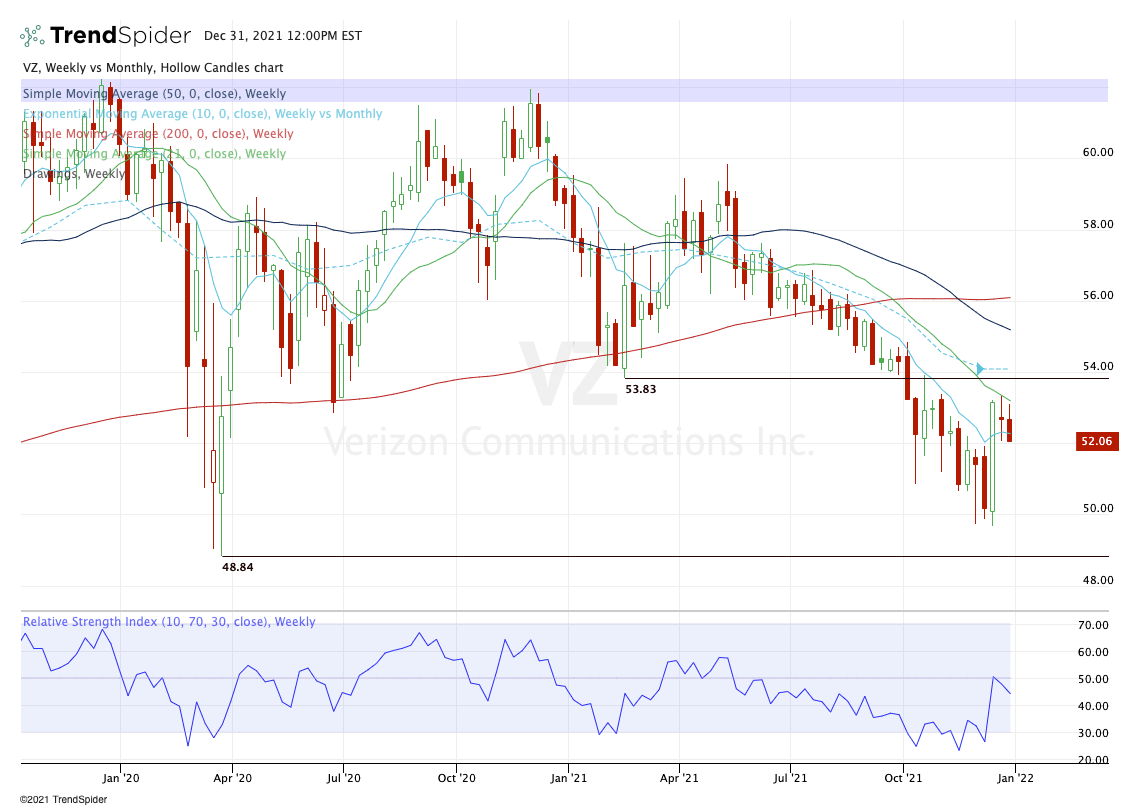
Next is Verizon, which is lower by 11.4% so far this year. If we include the dividend, the losses drop to just 7.5%.
The stock had a nice rip earlier this month, bursting back through $52 and the 10-week moving average. From here, bulls want to see these two levels hold as support.
Should they fail, it puts the $50 area back in play. For multiple weeks in a row, this level was strong support. If it fails, we could see a retest of the March 2020 low just below $49.
A dip to this $48.50 to $50 area that holds as supportcouldbe a dip-buying opportunity.
On the upside, let’s see if Verizon can push through the 21-week moving average and rally to the $54 level. Over $56 and who knows, perhaps Verizon can see the $60 to $62 zone again.
Trading Boeing Stock
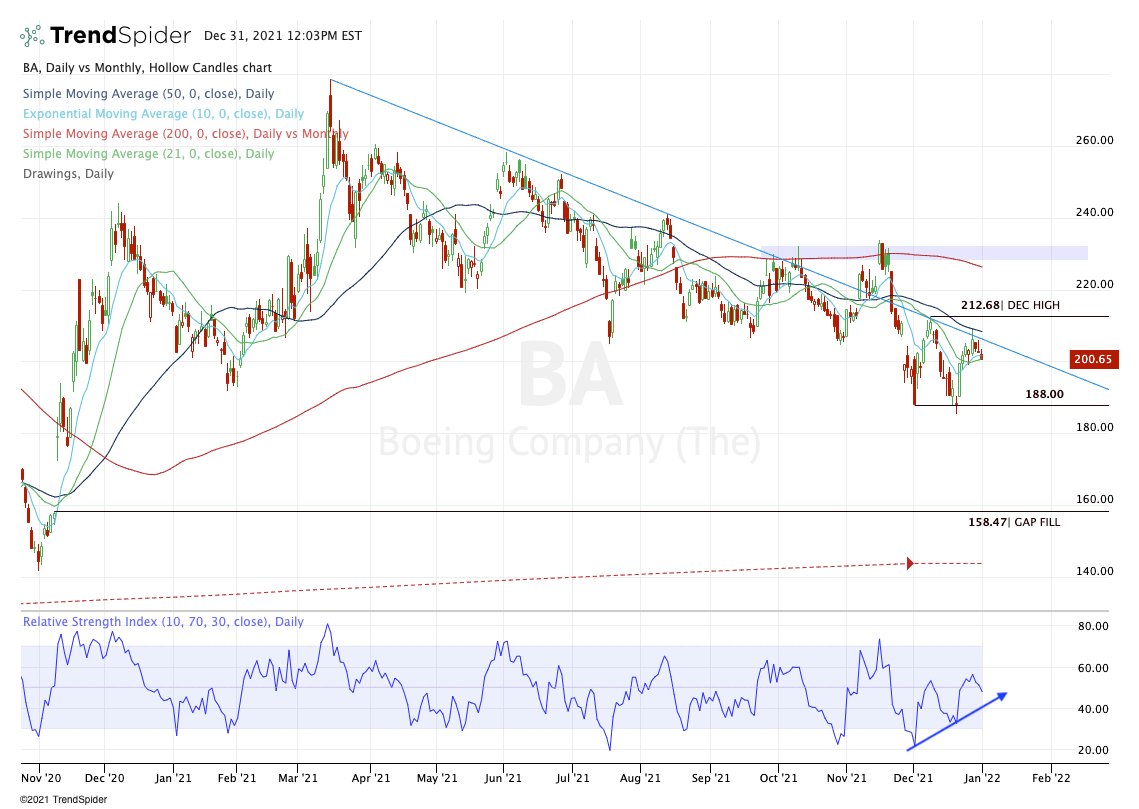
Boeing enjoyed a huge rally in late-2020 to its high of $278.57 in March 2021. Since then though, it’s been trapped in a brutal downtrend.
The stock recently bottomed just below $188 with strong divergence on the RSI (blue arrow) before rebounding in the latter half of December.
The key in the short-term will be $212.68 — the December high.
If Boeing stock can go monthly-up over this level in January, it could result in a quick move back up to the 200-day moving average. Above that and the $230 resistance zone is on the table.
On a break of the low near $185, Boeing stockcouldface more downside. Specifically, there is a pretty big unfilled gap down near $158.50.
Trading Merck Stock
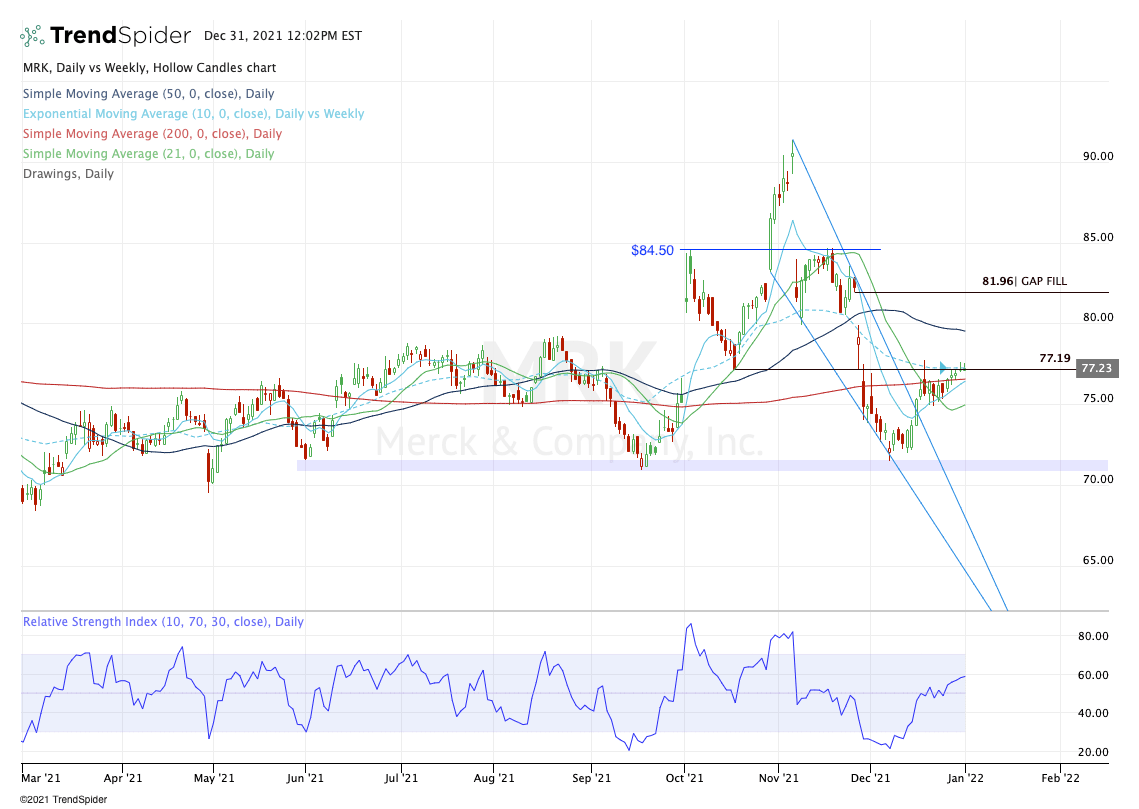
Merck stock went through what many traders call a falling wedge (blue lines). Now breaking out and up from the formation, bulls are looking for more gains in 2022.
That’s particularly true as the stock was up 17% on the year less than two months ago. Now Merck stock isdown5.7% for 2021.
From the November high to the recent low, shares were down almost 22%.
A push over $77.50 puts the 50-day moving average in play, followed by the gap-fill near $82. On a move over $84.50, Merck stock could make another push up toward $90 and the gap-fill.
It also pays a 3.6% dividend yield for investors that are interested.
Trading Honeywell Stock
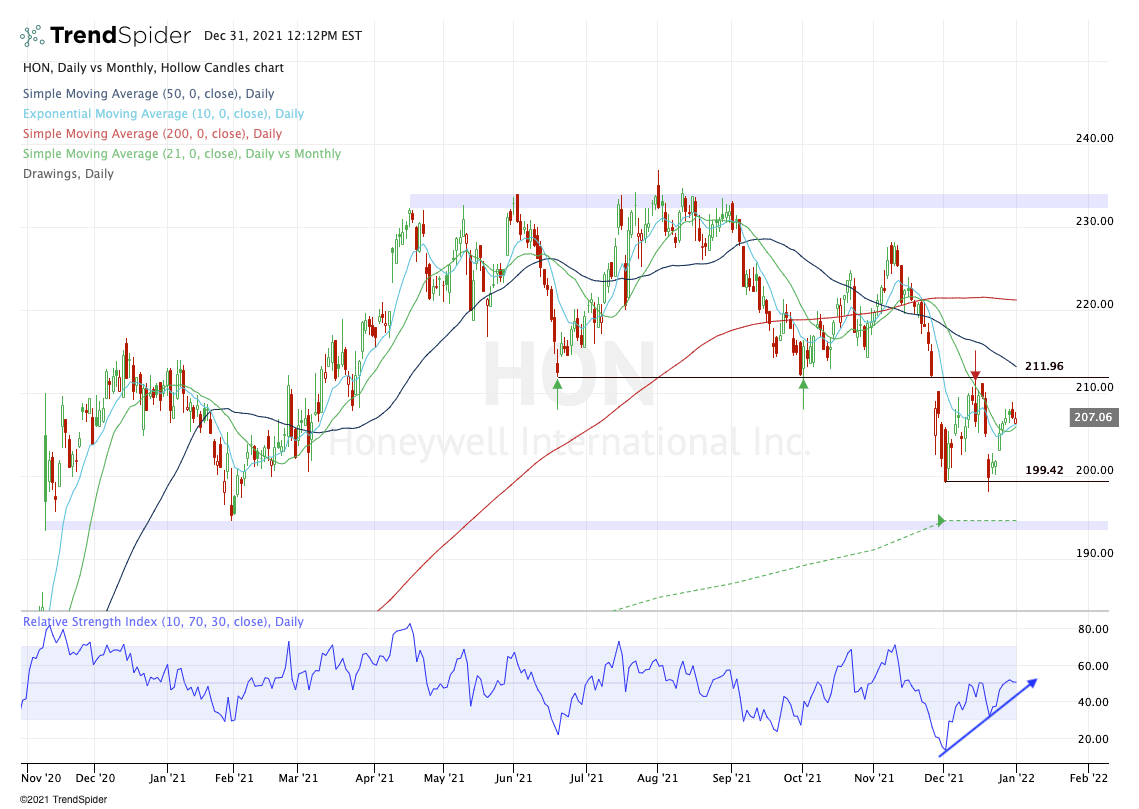
Last but not least we have Honeywell, which is down 2.6% on the year. With the dividend, the stock is down just 0.6%.
Like Boeing, Honeywell stock barely cracked the December low last week, but rebounded hard when it did — and did so with strong divergence on the RSI (blue arrow).
That said, Honeywell isn’t making a higher high yet.
On a rally, let's see how it handles the $212 area. Not only is this a key level, but it’s also likely where the declining 50-day moving average will come into play.
A push through this area likely puts the 200-day moving average on the table. Above the 200-day opens the door to the $235 resistance zone.
If shares dip below the 10-day and 21-day moving average, it’s possible the stock retests the $200 area.
A break of the low at $198.10 could put the low $190s and the 21-month moving average in play. Below that and there is a large unfilled gap down at $186.