
Crude oil shot up more than 3% in only one day amid rising demand and a supply disruption, while many oil and gas stocks were up even more

Some investors might feel guilty about making money on fossil fuels, but the table appears set for more gains in energy-stock prices.
Take a look at this chart showing price movement for continuous forward-month West Texas intermedia crude oil contracts over the past year:
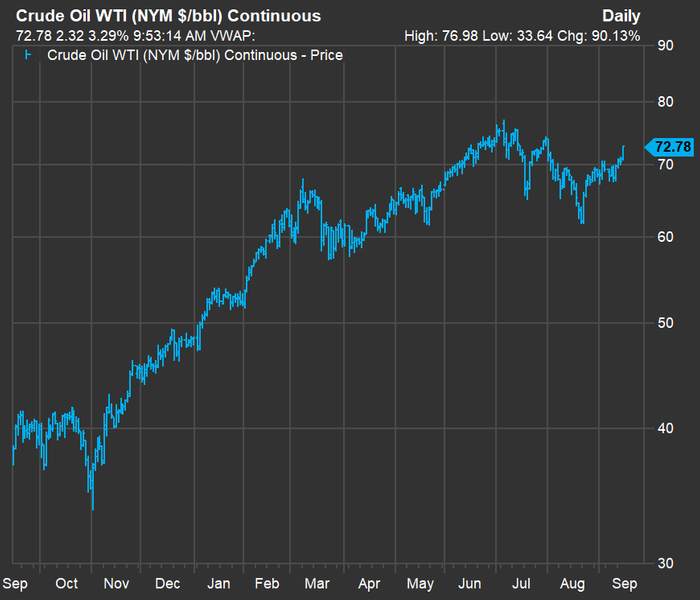
WTI was up 3.3% early on Sept. 15 to $72.78 a barrel -- quite a bump for only one trading session. And among the 32 energy stocks listed below, all but one were up in morning trading, with gains of as much as 6.9%.
WTI has risen 90% over the past year. But to put that into perspective, it actually peaked at a much higher intraday price of $112.24 on Aug. 28. 2013, before its long decline to a low of $26.05 on Feb. 11, 2016. Then it rose has high as $76.90 before its pandemic crash. You probably remember that moment in in April of 2020 when forward-month oil futures briefly dropped into negative territory amid the pandemic disruption. Now, with increasing demand for oil and natural gas as the world economy recovers from the COVID-19 slowdown, along with temporary disruptions in oil and natural gas production in the Gulf of Mexico and the disruption of wind electricity generation in the North Sea as Europe heads into home heating season, the table is set for a continued increase in energy commodity prices.
Deeper dive into oil and natural gas stocks
Last week, as part of the MarketWatch Premium series, we looked at energy partnerships and the 30 oil stocks included in the Russell 1000 Index . Now it's time to expand the screen to the 108 energy stocks included in the Russell 3000 index. The Russell 3000 represents about 98% of the U.S. stock market.
Among the 108 energy stocks, 89 are covered by at least five analysts polled by FactSet. This is a reasonable cut-off, for a variety of opinions.
Among the 89 remaining energy stocks, 32 are rated "buy" or the equivalent by at least 75% of analysts. Here they are, sorted by the 12-month upside potential implied by consensus price targets, with dividend yields on the right:
| Company | Industry | Price -- 10:15 a.m. ET on Sept. 15, 2021 | Price change -- Sept. 15 | Share "buy" ratings | Consensus price target | Implied 12-month upside potential | Dividend yield |
| Earthstone Energy Inc. Class A ESTE | Integrated Oil | $8.65 | 3.7% | 86% | $14.71 | 70% | 0.00% |
| Renewable Energy Group Inc. REGI | Chemicals: Specialty | $49.45 | 3.3% | 81% | $83.00 | 68% | 0.00% |
| Falcon Minerals Corp. Class A FLMN | Integrated Oil | $4.50 | 1.8% | 75% | $6.73 | 49% | 8.82% |
| Penn Virginia Corp. PVAC | Oil & Gas Production | $21.57 | 6.7% | 80% | $32.00 | 48% | 0.00% |
| National Energy Services Reunited Corp. NESR | Oilfield Services/ Equipment | $11.99 | 3.1% | 100% | $17.58 | 47% | 0.00% |
| Dorian LPG Ltd. LPG | Marine Shipping | $11.67 | -0.2% | 75% | $17.00 | 46% | 0.00% |
| Diamondback Energy Inc. FANG | Oil & Gas Production | $80.03 | 5.7% | 91% | $113.94 | 42% | 2.38% |
| Northern Oil and Gas Inc. NOG | Oil & Gas Production | $18.30 | 3.6% | 100% | $26.04 | 42% | 1.02% |
| PDC Energy Inc. PDCE | Oil & Gas Production | $43.95 | 6.9% | 88% | $60.88 | 39% | 1.17% |
| Talos Energy Inc. TALO | Oil & Gas Production | $13.49 | 4.8% | 100% | $18.29 | 36% | 0.00% |
| Green Plains Inc. GPRE | Chemicals: Specialty | $34.23 | 1.7% | 90% | $46.10 | 35% | 0.00% |
| EOG Resources Inc. EOG | Oil & Gas Production | $73.56 | 5.8% | 75% | $98.95 | 35% | 2.37% |
| Bonanza Creek Energy Inc. BCEI | Integrated Oil | $45.60 | 5.7% | 100% | $60.50 | 33% | 3.25% |
| NexTier Oilfield Solutions Inc. NEX | Oilfield Services/ Equipment | $4.31 | 6.4% | 89% | $5.72 | 33% | 0.00% |
| Matador Resources Co. MTDR | Oil & Gas Production | $30.27 | 4.9% | 79% | $39.71 | 31% | 0.35% |
| Devon Energy Corp. DVN | Oil & Gas Production | $29.49 | 4.3% | 85% | $38.42 | 30% | 4.39% |
| Pioneer Natural Resources Co. PXD | Oil & Gas Production | $159.07 | 4.0% | 83% | $206.79 | 30% | 1.46% |
| ConocoPhillips COP | Oil & Gas Production | $59.19 | 3.9% | 97% | $75.44 | 27% | 3.02% |
| Valero Energy Corp. VLO | Oil Refining/ Marketing | $65.68 | 1.5% | 86% | $83.41 | 27% | 6.06% |
| Oasis Petroleum Inc. OAS | Oil & Gas Production | $97.53 | 4.4% | 86% | $123.71 | 27% | 1.60% |
| Denbury Inc. DEN | Integrated Oil | $70.29 | 5.0% | 83% | $87.82 | 25% | 0.00% |
| Schlumberger Ltd. SLB | Oilfield Services/ Equipment | $28.89 | 4.4% | 80% | $35.90 | 24% | 1.81% |
| Marathon Petroleum Corp. MPC | Oil Refining/ Marketing | $58.91 | 2.3% | 84% | $70.00 | 19% | 4.03% |
| ChampionX Corp. CHX | Chemicals: Specialty | $23.50 | 4.2% | 80% | $27.72 | 18% | 0.00% |
| Targa Resources Corp. TRGP | Oil Refining/ Marketing | $45.72 | 3.4% | 83% | $53.48 | 17% | 0.90% |
| Cactus Inc. Class A WHD | Oilfield Services/ Equipment | $36.47 | 3.9% | 80% | $42.56 | 17% | 1.14% |
| Chesapeake Energy Corp. CHK | Integrated Oil | $64.68 | 4.8% | 75% | $75.00 | 16% | 2.23% |
| Cheniere Energy Inc. LNG | Oil & Gas Pipelines | $91.26 | 3.1% | 96% | $105.05 | 15% | 1.49% |
| Williams Cos. WMB | Oil & Gas Pipelines | $25.39 | 2.6% | 83% | $29.05 | 14% | 6.63% |
| Baker Hughes Co. Class A BKR | Oilfield Services/ Equipment | $25.15 | 3.3% | 90% | $28.24 | 12% | 2.96% |
| Whiting Petroleum Corp. WLL | Oil & Gas Production | $55.55 | 5.3% | 75% | $62.13 | 12% | 0.00% |
| Energy Fuels Inc. CA:EFR | Other Metals/ Minerals | $10.04 | 5.9% | 100% | $9.73 | -3% | 0.00% |
Wall Street analysts use 12-month price targets, but that can actually be a short period for a long-term investor. The last stock on the list, Energy Fuels Inc. , has unanimous "buy" ratings but has gotten ahead of its price target.