
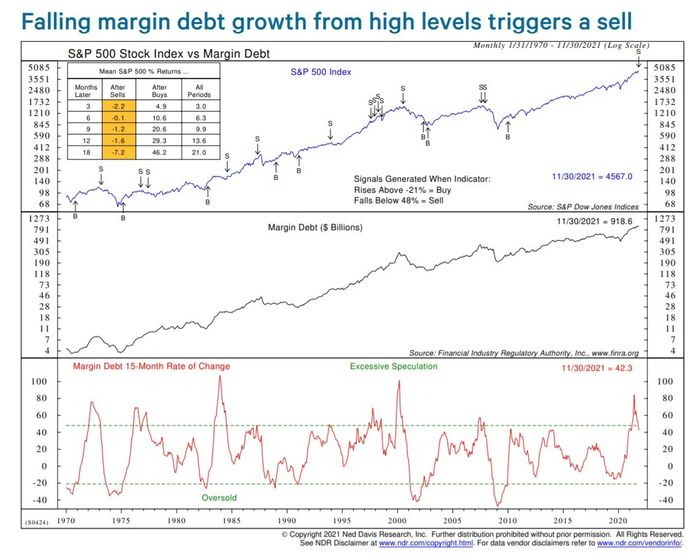
They don't ring a bell at the top, the expression goes, but here's an indicator that topped in 2000 and 2007.

It has to do with margin debt. According to Ned Davis, senior investment strategist at Ned Davis Research, falling margin debt growth, from high levels, triggers a sell warning. When the 15-month rate of change in margin debt falls below 48%, the market was lower three to 18 months later, on average.
Another warning sign is that price-to-earnings ratios on what the firm calls institutional grade stocks are stretched.
Yet Davis can't quite bring himself to fully cloak himself in pessimism. Short-term sentiment is still negative, he points out, which usually is a good sign for markets.
"I would note however, that following any rally, a break of the December low is often a warning sign. So we will be watching the year-end rally closely," he says. The S&P 500 touched its lowest level for the 12th month on Dec. 3, when it reached 4,495.12.
The chart
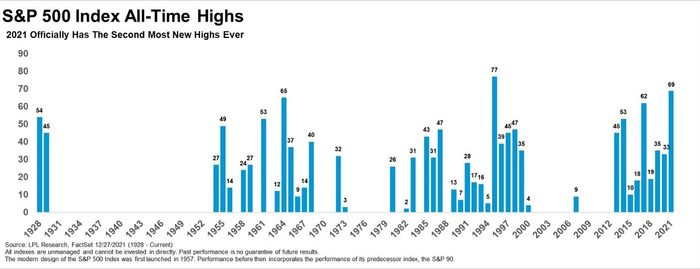
It's already out of date, but this chart showing all-time highs for the S&P 500 was picked by Ryan Detrick, chief market strategist of LPL Financial, as the chart of the year. The benchmark U.S. index has registered 70 record highs, the highest number since 1995. "At the end of the day, the fact that 2021 had the second-most all-time highs ever probably tells the story better than nearly any other," he said.